Unlike most other texture analysis software MTEX does not have any graphical user interface. Instead the user is supposed to write scripts. Those scripts usually have the following structure
- import data
- inspect the data
- correct the data
- analyze the data
- plot and export the results of the analysis
During all these steps the data are stored as variables of different type. There are many different types of variables (called classes) for different objects, like vectors, rotations, EBSD data, grains or ODFs. A complete list of all classes and all functions can be found in the Function Reference.
Variables are generated automatically when data are imported. E.g., the commands
fileName = [mtexEBSDPath filesep 'Forsterite.ctf'];
ebsd = EBSD.load(fileName,'EulerCorrection',rotation.byAxisAngle(xvector,180*degree))
ebsd = EBSD (y↑→x)
Phase Orientations Mineral Color Symmetry Crystal reference frame
0 58485 (24%) notIndexed
1 152345 (62%) Forsterite LightSkyBlue mmm
2 26058 (11%) Enstatite DarkSeaGreen mmm
3 9064 (3.7%) Diopside Goldenrod 12/m1 X||a*, Y||b*, Z||c
Properties: bands, bc, bs, error, mad
Scan unit : um
X x Y x Z : [0, 36550] x [0, 16750] x [0, 0]
Normal vector: (0,0,1)imports data from the file fileName.ctf and stores them in the variable ebsd of type EBSD.
Next one can pass the variable ebsd to different MTEX function. E.g. to plot a phase plot one simply does
plot(ebsd)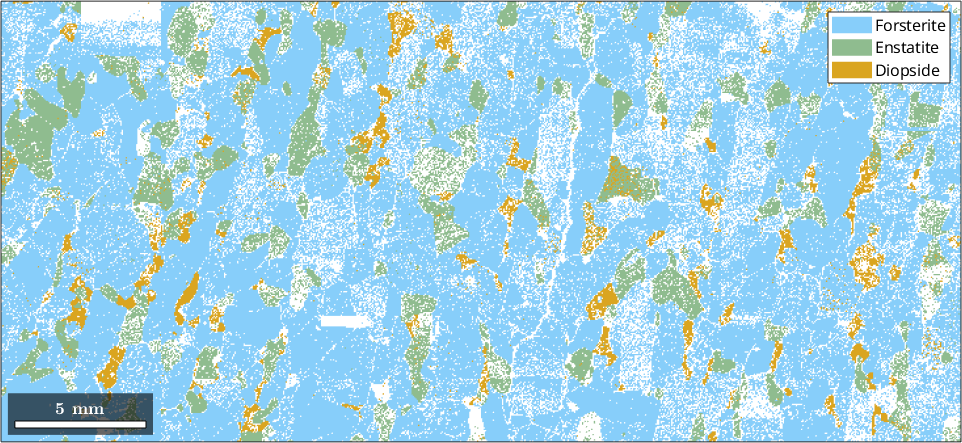
The grain structure is reconstructed by the command
grains = calcGrains(ebsd('indexed'),'minPixel',3)grains = grain2d (y↑→x)
Phase Grains Pixels Mineral Symmetry Color
1 484 151683 Forsterite mmm LightSkyBlue
2 223 25747 Enstatite mmm DarkSeaGreen
3 229 7674 Diopside 12/m1 Goldenrod
boundary segments: 36800 (1.7e+06 µm)
inner boundary segments: 287 (13197 µm)
triple points: 1549
Properties: meanRotation, GOSwhich returns a new variable of type grain2d, here called grains. This variable contains the entire grain structure. Finally, we my visualize this structure by
hold on
plot(grains.boundary,'linewidth',2)
hold off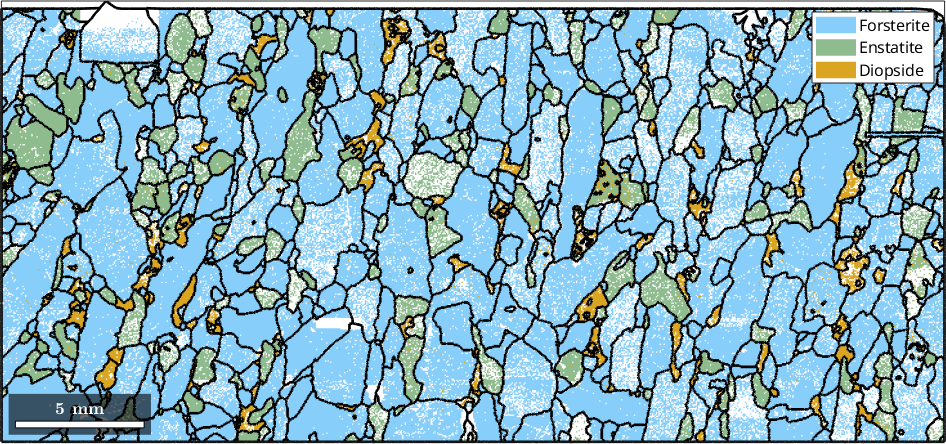
An MTEX script is a sequence of MTEX commands. Usually, these are accompanied by comments (lines starting with %), describing the purpose of each command and making the script understandable in the future. It is also good practice to subdivide MTEX scripts into sections by adding lines starting with %% and executing those scripts only section by section Shift Strg Enter.