
A spherical harmonic representation replaces a function by coefficients of standard wave-like patterns on the sphere. This is the spherical counterpart of representing a periodic signal by sines and cosines. Once the coefficients are known, MTEX can evaluate, rotate, differentiate, and integrate the function efficiently.
The preceding Sampling page used a bandwidth to state how much detail a discrete sample should preserve. Here we inspect that detail directly in an S2FunHarmonic.
plottingConvention.default('y↑→x');
close all
Construct a function from coefficients
MTEX stores harmonic coefficients degree by degree in the fhat property. Degree zero contributes one coefficient. Degree one contributes the next three, ordered by harmonic order \(-1\), 0, and 1. The vector below therefore sets \(\hat f_0^0=1\), \(\hat f_1^{-1}=0\), \(\hat f_1^0=3\), and \(\hat f_1^1=0\).
fun = S2FunHarmonic([1;0;3;0])

plot(fun)
mtexColorbar
fun = S2FunHarmonic (y↑→x)
bandwidth: 1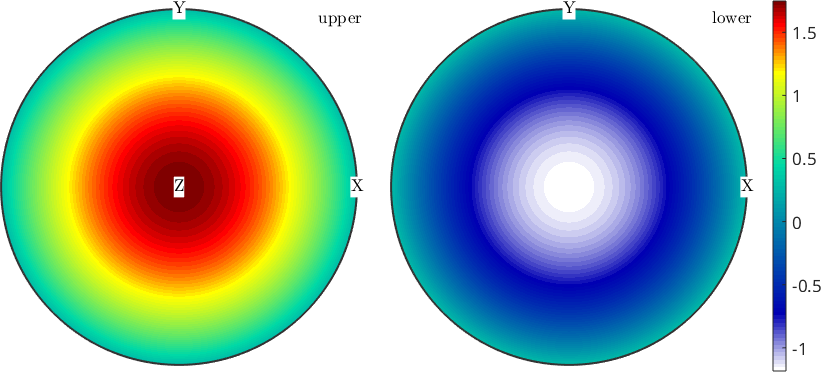
Read the coefficient example
This function has maximum harmonic degree 1. Its degree-zero coefficient supplies a constant part, while the nonzero degree-one coefficient makes the value change from one pole to the other. The smooth, broad variation is characteristic of a low-bandwidth function.
What bandwidth controls
The bandwidth, also called the harmonic cut-off degree, is the largest degree retained in the series. Smooth functions often need only a small bandwidth. Jumps, sharp edges, and narrow features require higher degrees. If the bandwidth is too small, truncation can blur those features and add oscillations around them.
The next figure starts from a degree-256 representation of the smiley. It then retains degrees 256, 128, 64, 32, 16, and 8.
sF = S2FunHarmonic(sqrt(abs(S2Fun.smiley('bandwidth',256))),'bandwidth',256);

newMtexFigure('layout',[2,3]);
for bw = [256 128 64 32 16 8]
  sF.bandwidth = bw;
  nextAxis
  pcolor(sF,'upper','colorRange',[0,0.75]);
  mtexTitle(['M = ' num2str(bw)]);
end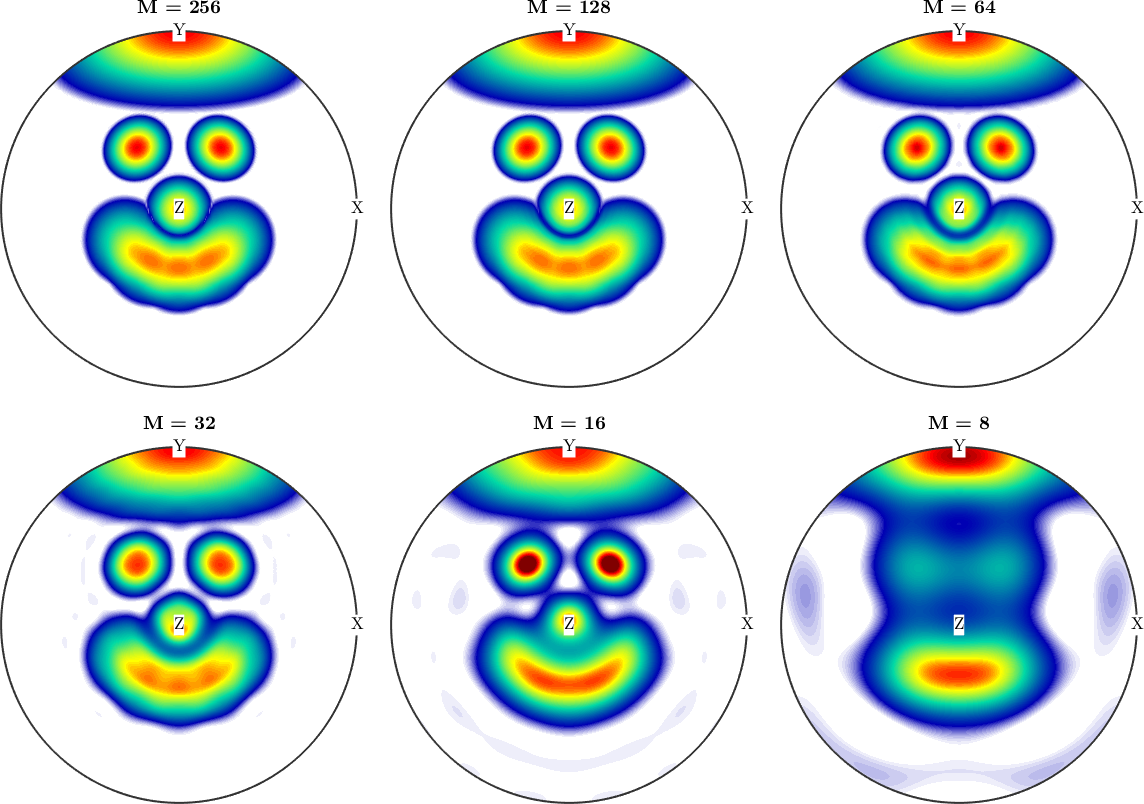
Read the truncation sequence
At degrees 256 and 128, the eyes and mouth have crisp boundaries. At degrees 64 and 32, the features broaden and oscillatory rings become visible. Degrees 16 and 8 no longer preserve the shape of the smile. This sequence turns bandwidth into a practical choice: lower it only until the feature or derived quantity of interest begins to change.
Compute coefficients from a callable function
Coefficients need not be entered by hand. Suppose a rule can evaluate \(f(\mathbf{v})\) at arbitrary directions. A simple example is \(f(\mathbf{v})=(\mathbf{v}\cdot\mathbf{x})^3\). The ninth power below uses the same construction but exposes more nonzero harmonic degrees.
valueFunction = @(v) dot(v,vector3d.X).^9; S2FunHarmonic.quadrature evaluates this handle on a weighted spherical grid and computes its coefficients. Without an explicit 'bandwidth' option, it computes through degree 128.
S2F = S2FunHarmonic.quadrature(valueFunction)
defaultBandwidth = S2F.bandwidth

plot(S2F,'upper')
mtexColorbar
S2F = S2FunHarmonic (y↑→x)
bandwidth: 128
defaultBandwidth =
128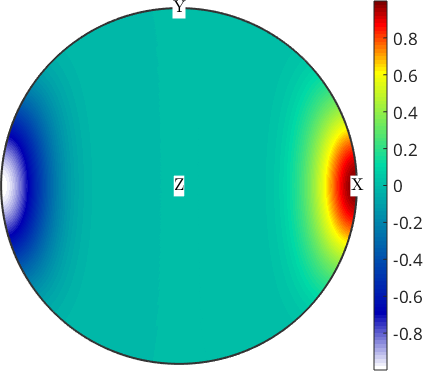
Read the ninth-power function
The value is positive around specimen X and negative around the opposite direction. It vanishes on the great circle perpendicular to X. Although the default representation stores degrees through 128, this polynomial needs no degree above 9.
Inspect the harmonic spectrum
plotSpektra groups coefficients by degree. At degree \(m\), it plots \(\left(\sum_{k=-m}^{m}|\hat f_m^k|^2\right)^{1/2}\).
close all
plotSpektra(S2F,'figSize','small')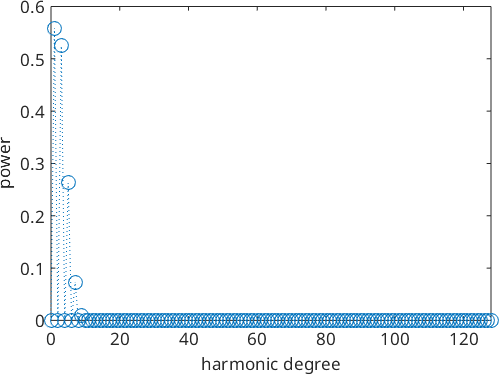
Read the spectrum
Only odd degrees through 9 carry visible power. The earlier statement that almost all coefficients were zero except for the very first one was too strong: the ninth power contains contributions at degrees 1, 3, 5, 7, and 9. Coefficients beyond degree 9 are numerical quadrature noise.
Remove negligible degrees
truncate removes trailing degrees whose coefficients are negligible relative to the spectrum. It does not refit the function. Here it reduces the stored bandwidth from 128 to 9.
S2F = S2F.truncate
truncatedBandwidth = S2F.bandwidth

plotSpektra(S2F,'linewidth',2,'figSize','small')
S2F = S2FunHarmonic (y↑→x)
bandwidth: 9
truncatedBandwidth =
9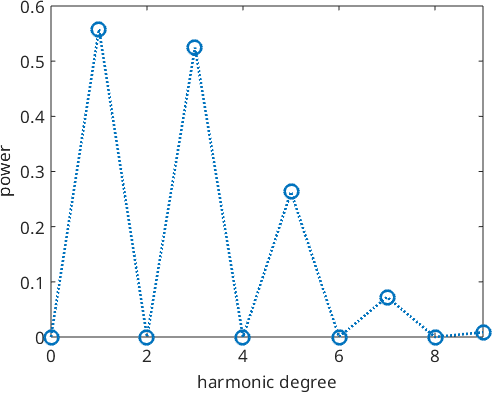
Read the truncated spectrum
The same five nonzero odd degrees remain, while the empty high-degree tail has disappeared. For coefficients estimated from discrete noisy data, deciding where signal ends is a model choice rather than an exact polynomial test. Spherical Approximation and Interpolation explains how MTEX estimates such coefficients from scattered values.
See the first ten basis functions
To conclude, the following command plots the first ten spherical harmonics. Each column of the identity matrix selects one basis function.
surf(S2FunHarmonic(eye(10)),'figSize','small')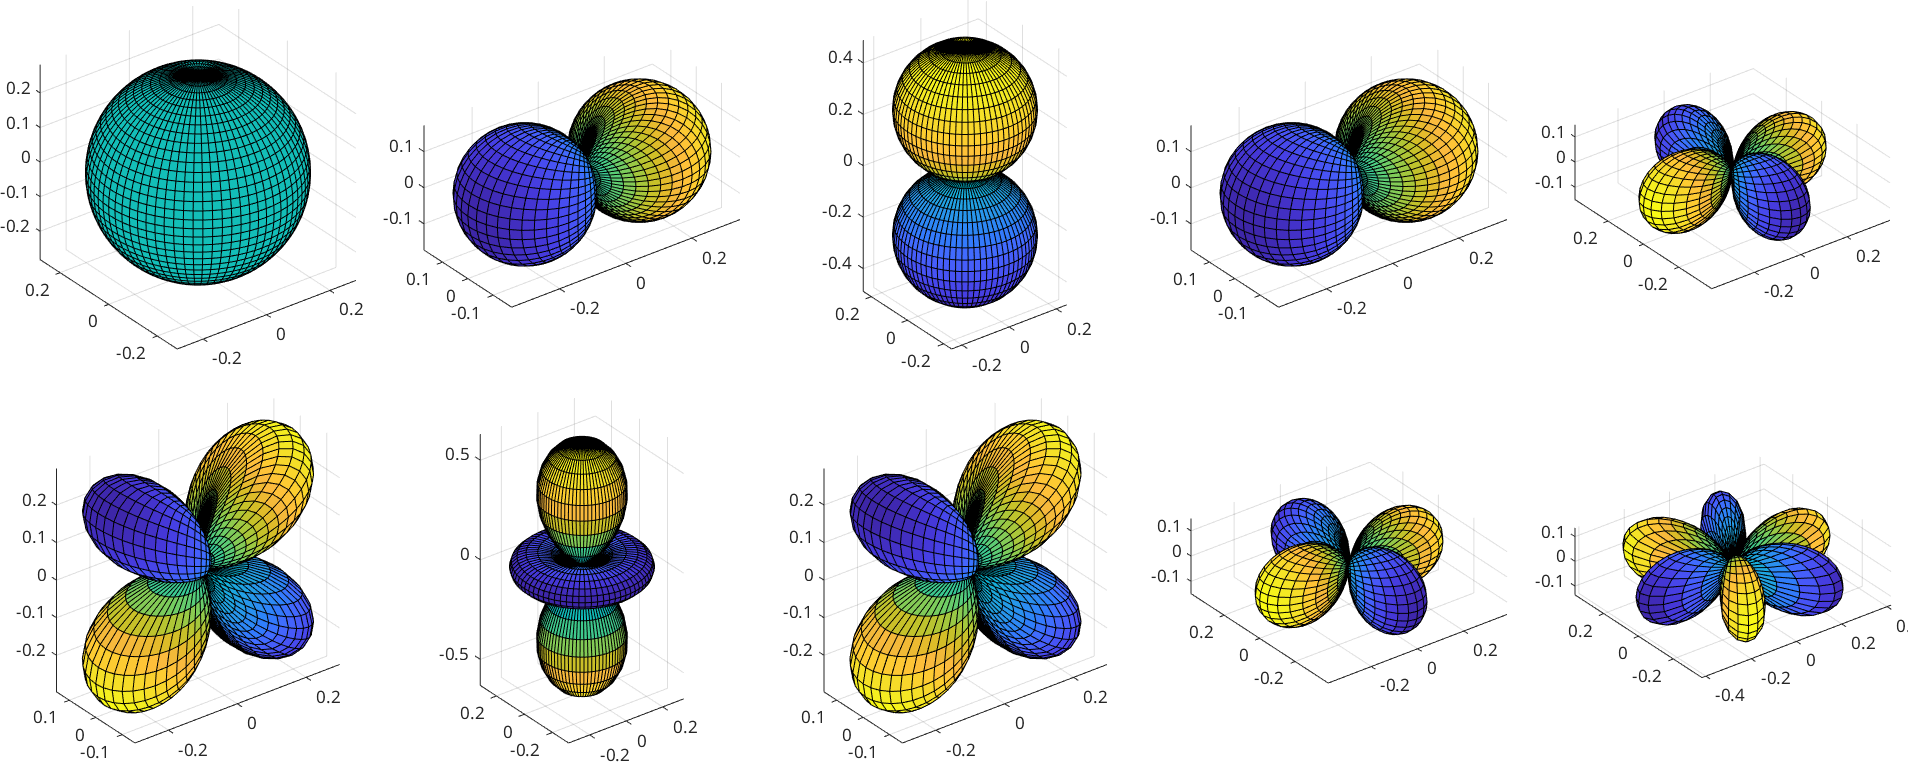
Constant, dipolar, and progressively finer angular patterns appear as the coefficient index increases. These basis patterns are what the preceding examples add together.
The maths behind the representation
A function of bandwidth \(M\) has the finite expansion
\[ f(\mathbf{v}) = \sum_{m=0}^{M}\sum_{l=-m}^{m} \hat f_m^l Y_m^l(\mathbf{v}). \]
Here \(Y_m^l\) is the spherical harmonic of degree \(m\) and order \(l\). Spherical Harmonics defines these basis functions. MTEX uses an orthonormal convention, so
\[ \|Y_m^l\|_2=1 \]
for every \(m\) and \(l\). Other normalizations occur in the literature, so coefficients from another package must use the same convention before they are assigned to fhat. The Integration and norms section defines the \(L^2\) norm used here.
References
- J. R. Driscoll and D. M. Healy, Computing Fourier transforms and convolutions on the 2-sphere, Advances in Applied Mathematics 15 (1994), 202--250, develops the bandwidth-limited spherical harmonic representation and its fast transforms.
Next
Continue with Bingham Distribution to construct a normalized antipodal spherical density from principal axes and concentration parameters.
Citing this page.
This page is part of the documentation of
MTEX, a free and open
source MATLAB toolbox for analyzing and modeling crystallographic textures.
It was written by The MTEX Developers and is published at
https://mtex-toolbox.github.io/S2FunHarmonicRepresentation.html.
If you use MTEX, or reuse text or figures from this page, in your research,
please cite
F. Bachmann, R. Hielscher, H. Schaeben: Texture Analysis with MTEX - Free and Open Source Software Toolbox, Solid State Phenomena 160 (2010), 63-68. 10.4028/www.scientific.net/SSP.160.63
BibTeX
@article{bachmann2010mtex,
  author  = {F. Bachmann and R. Hielscher and H. Schaeben},
  title   = {Texture Analysis with MTEX - Free and Open Source Software Toolbox},
  journal = {Solid State Phenomena},
  volume  = {160},
  pages   = {63-68},
  year    = {2010},
  doi     = {10.4028/www.scientific.net/SSP.160.63},
  url     = {https://doi.org/10.4028/www.scientific.net/SSP.160.63}
}
Other papers describing specific MTEX methods are listed under Publications — please cite the one that best fits your application. The MTEX source code is licensed under the GNU General Public License v2.0; the text and figures of this documentation are licensed under CC BY 4.0, which permits reuse — including by automated systems — provided The MTEX Developers and this page are credited.