
The outline of a grain is a polygon with hundreds of vertices. A shape parameter compresses that outline into a number that can be plotted, histogrammed, and compared between specimens. The price is that almost all other information about the outline is lost.
This page covers direct measurements of a grain in a two-dimensional section. It assumes that the grains have been reconstructed and explains why their boundaries are smoothed. Use Selecting Grains first if selecting complete grains away from the map edge is unfamiliar.
A measured section is not a three-dimensional grain. Large grains are more likely to be cut, and most cuts miss the widest part of a grain. Quantities such as area and equivalentRadius therefore describe the observed section unless a stereological model or a standard says how to infer a three-dimensional size from them.
The most useful scalar properties are listed below. Lengths are returned in the map's measurement unit and areas in its square.
|
numPixel |
number of measurements in the grain |
area of the section |
|
|
number of outline segments |
length of the outline |
||
|
number of subgrain boundary segments |
length of subgrain boundaries |
||
|
largest vertex-to-vertex distance |
caliper or Feret diameter |
||
|
perimeter of the equal-area circle |
radius of the equal-area circle |
||
|
perimeter divided by equivalent perimeter |
indentation relative to the convex hull |
||
|
boundary irregularity in the ice-grain example |
does the grain touch the map edge? |
||
|
does the grain enclose another grain? |
is the grain enclosed by another grain? |
||
|
number of neighbouring grains |
list of triple points |
||
|
list of grain boundary segments |
list of subgrain boundary segments |
||
|
x, y |
coordinates of the outline vertices |
area centroid |
A hole and an inclusion are the same enclosure viewed from opposite sides. The containing grain has a hole, and the contained grain is an inclusion.
% load sample EBSD data in its specimen plotting frame
plottingConvention.default('y↑→x');
mtexdata forsterite silent

% restrict the map to a region of interest and indexed measurements
ebsd = ebsd(inpolygon(ebsd,[5 2 10 5]*10^3));
ebsd = ebsd('indexed');

% reconstruct and smooth the grains
[grains,ebsd] = calcGrains(ebsd,'angle',5*degree,'minPixel',5);
grains = smoothBoundary(grains,5);
mapGrains = grains;

% plot forsterite orientations and the reconstructed boundary network
plot(ebsd('Fo'),ebsd('Fo').orientations,'ipfDirection',zvector)
hold on
plot(grains.boundary,'lineWidth',2)
hold off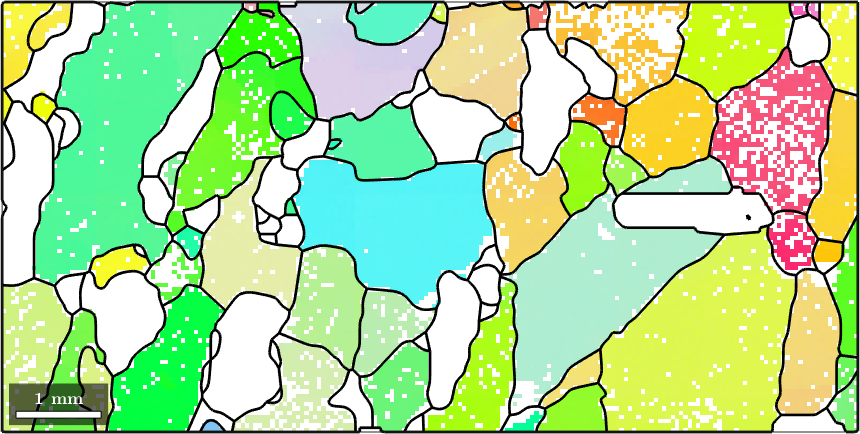
The black network separates the reconstructed grains. Smoothing has removed the square-grid staircase while retaining the larger-scale turns of the boundaries. It is a measurement choice, not recovered sub-pixel detail.
A grain touching the map edge continues beyond the measured field. Its visible area and outline are truncated, so we exclude such grains from the per-grain comparisons below. A standardised average grain-size method may prescribe a different edge-counting rule.
grains = grains(~grains.isBoundary);Pixel count and area
Size comes in two forms: the number of measurements assigned to a grain and the area occupied by its observed section.
grains(9).numPixel
grains(9).area
ans =
19
ans =
8.6813e+04
numPixel is a count, while area is in the square of the map unit. They are proportional only when one step size is used throughout the map. The count is useful during reconstruction because 'minPixel' is expressed in it. Physical area is usually the quantity to report.
The number-weighted area distribution is strongly skewed.
close all
histogram(grains.area)
xlabel('grain area')
ylabel('number of grains')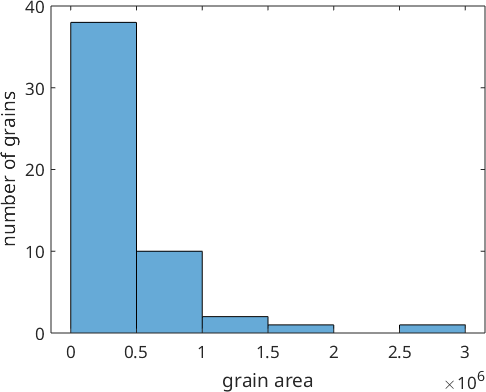
Nearly every grain falls into the first bar. The plot answers how many grains have each area, so numerous small grains dominate even when they occupy little of the section.
Weighting each grain by its area asks a different question: what fraction of the observed section belongs to grains in each size class? hist(grains) draws grouped bars, one colour per indexed phase.
hist(grains);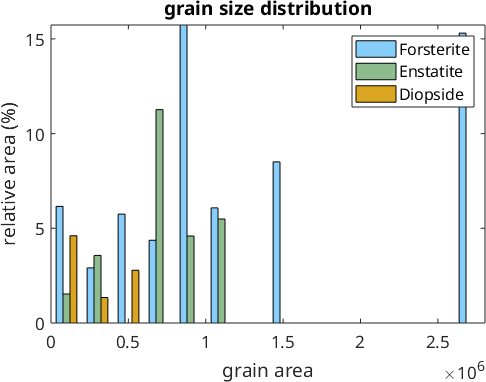
The small-grain bar is much less dominant after area weighting. Each bar height is now a percentage of the analysed section rather than a grain count. histogram(grains) draws the same values as overlaid phase histograms instead of side-by-side bars.
histogram(grains);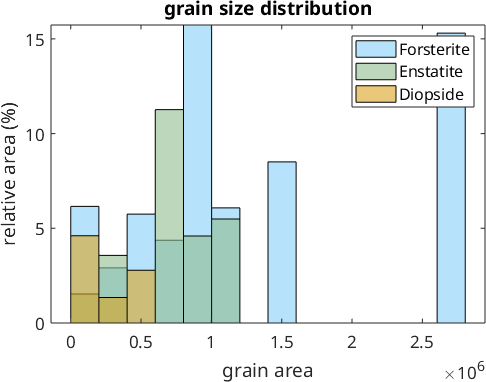
The phase distributions overlap; they are not stacked and their heights should not be added by eye. The many tiny grains remain in the list, but they contribute little area. The largest forsterite grain and its fraction of the analysed interior-grain area are printed below.
forsteriteArea = grains('Fo').area;
largestForsteriteArea = max(forsteriteArea)
largestForsteriteFraction = largestForsteriteArea ./ sum(grains.area)
largestForsteriteArea =
2.8049e+06
largestForsteriteFraction =
0.1531The largest forsterite section covers 2.805 mm² and accounts for 15.31 percent of the analysed interior-grain area. The many small grains have not gone away; area weighting has changed how much each one counts.
Boundary segments and perimeter
boundarySize and perimeter are the same pair one dimension lower: a count of outline segments and their total length.
grains(9).boundarySize
grains(9).perimeter
ans =
31
ans =
1.4115e+03Both are shortcuts for asking the grain boundary itself, which is a list of segments with one segLength each.
length(grains(9).boundary)
sum(grains(9).boundary.segLength)
ans =
31
ans =
1.4115e+03The two pairs react differently to processing. numPixel remains tied to the measurements, whereas smoothing resamples the outline and can change both boundarySize and perimeter. By default, perimeter measures only the outer loop. The option 'withInclusion' adds the loops around grains enclosed inside it.
Diameter and the equivalent circle
The diameter is the longest distance between any two vertices of the outline. It is one of the directional caliper or Feret measures developed in Projection Parameters.
grains(9).diameterans =
573.5035Another characteristic length comes from the circle with the same area. Its equivalentRadius gives the diameter below. No shape of that area has a shorter perimeter than the circle, and no grain of that area has a smaller maximum diameter.
2*grains(9).equivalentRadius

grains(9).equivalentPerimeter
ans =
332.4671
ans =
1.0445e+03Departure from a circle
The shapeFactor is \(F=P/P_{\mathrm{eq}}\), where \(P\) is the perimeter and \(P_{\mathrm{eq}}\) is the equivalent perimeter. It is at least 1 and grows when a grain is elongated, indented, or ragged.
Other literature sometimes calls \(4\pi A/P^2=1/F^2\) the circularity or even the shape factor. State the formula when comparing values between software or publications.
shapeFactorSummary = [min(grains.shapeFactor),...
  median(grains.shapeFactor),max(grains.shapeFactor)]

plot(grains,grains.shapeFactor)
mtexColorbar('title','shape factor')
shapeFactorSummary =
1.0579 1.2208 1.6623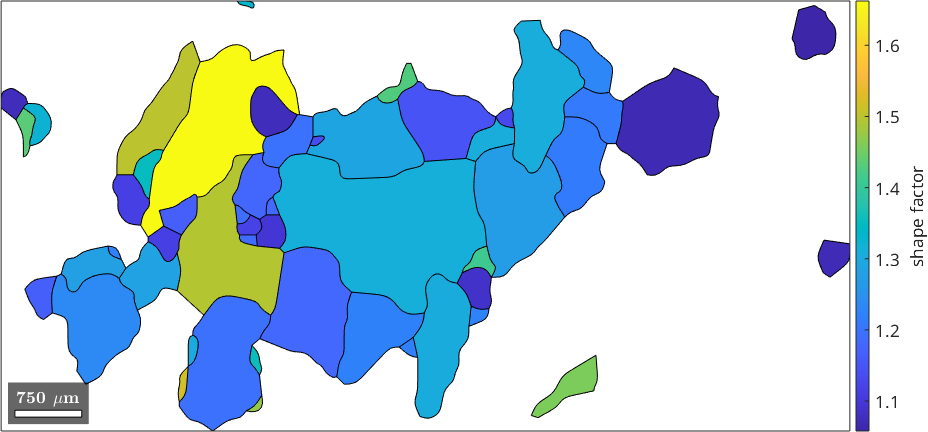
The minimum, median, and maximum are 1.058, 1.221, and 1.662. In the map, the high-value yellow grains are visibly lobed or elongated, while compact grains are dark blue. The measure cannot tell those causes apart: a smooth ellipse and a round grain with a frayed boundary can have the same value.
The same information can be scaled as the relative difference between the perimeter and the equivalentPerimeter.
relativePerimeter = (grains.perimeter - grains.equivalentPerimeter) ...
  ./ grains.perimeter;
plot(grains,relativePerimeter)
setColorRange([0,0.5])
mtexColorbar('title','relative perimeter difference')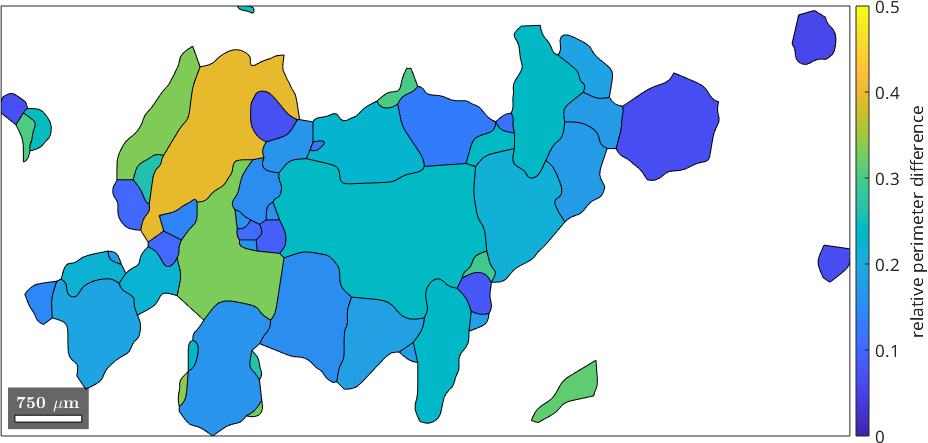
Round shapes are near zero in this map. The quantity equals \(1-1/F\) and is bounded above by 1 rather than being unbounded.
A third measure compares the perimeter with the grain's own convex hull. paris, the Percentile Average Relative Indented Surface, is reported in percent. An elongated but smoothly bounded grain has a small paris because its hull follows it closely. Bays and inlets increase it. Inclusion loops are excluded from both paris and the default perimeter. Convex Hull Parameters develops this comparison.
parisSummary = [median(grains.paris),max(grains.paris)]
C = corrcoef(grains.shapeFactor,grains.paris);
shapeParisCorrelation = C(1,2)

[~,shapeFactorExtreme] = max(grains.shapeFactor);
[~,parisExtreme] = max(grains.paris);
sameExtremeGrain = shapeFactorExtreme == parisExtreme

[~,mapShapeFactorExtreme] = max(mapGrains.shapeFactor);
[~,mapParisExtreme] = max(mapGrains.paris);
sameExtremeWithEdgeGrains = mapShapeFactorExtreme == mapParisExtreme

plot(grains,grains.paris)
mtexColorbar('title','paris')
parisSummary =
2.7659 43.3003
shapeParisCorrelation =
0.4715
sameExtremeGrain =
logical
1
sameExtremeWithEdgeGrains =
logical
0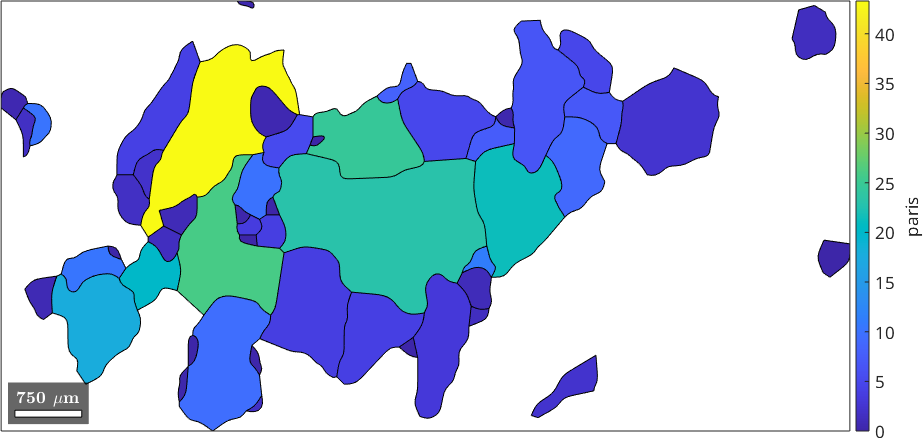
The median paris is 2.77 percent, its maximum is 43.30, and its correlation with shapeFactor is 0.472. Among the complete grains, both measures select the same extreme grain. In the full plotted map, including truncated edge grains, they select different extremes. Their partial agreement is the point: shapeFactor counts elongation as a departure from a circle, whereas paris does not. The changed selection also shows why the edge-grain rule belongs in a reported method.
Perimeter-area fractal dimension
Boundary length depends on the scale at which it is measured. This is the coastline problem. A perimeter-area fractal dimension describes how rapidly perimeter grows with grain size across a population and has been related to dynamic-recrystallisation conditions.
This is a population estimator, not a box-counting dimension of one grain. It assumes that the grains are statistically self-similar over the fitted size range. If \(P\propto r^D\), a straight line fitted to \(\log(P)\) against \(\log(r)\) has slope \(D\). A family of geometrically similar smooth grains has \(D=1\); increasingly convoluted boundaries can give a slope between 1 and 2.
% reconstruct the grains of the full data set once
mtexdata forsterite silent
rawGrains = calcGrains(ebsd);
rawGrains = rawGrains(~rawGrains.isBoundary);

% use five smoothing iterations for the main estimate
grains = smoothBoundary(rawGrains,5);

close all
scatter(grains.equivalentRadius,grains.perimeter)
xlabel('equivalent radius')
ylabel('perimeter')

% set both axes to logarithmic scales
logAxis(gca,[10,10^4],[10^2,10^5])

% fit and draw a straight line in log space
ab = polyfit(log(grains.equivalentRadius),log(grains.perimeter),1);
fitRadius = [10,10^4];
hold on
plot(fitRadius,exp(ab(2) + ab(1) * log(fitRadius)),'LineWidth',3)
hold off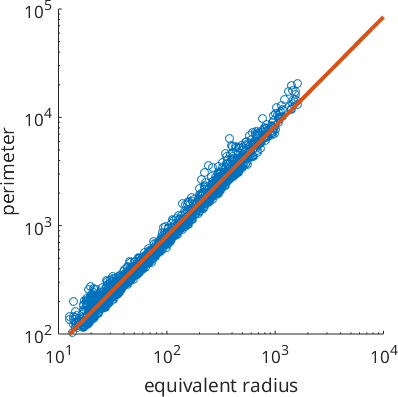
The points scatter around the fitted line because individual grains are not scaled copies of one shape. The fitted slope, 1.010, is the estimated perimeter-area fractal dimension.
fractalDimension = ab(1)fractalDimension =
1.0098Treat the estimate with care. Pixel spacing sets the smallest visible feature, small grains provide very few boundary samples, and smoothing removes exactly the excursions that the measure is intended to count. The next comparison reuses one reconstruction so that only the boundary processing changes. The zero-iteration case is the actual pixel staircase; calling smoothBoundary(rawGrains,0) would still simplify and resample it.
for iter = [0 5 25]
  if iter == 0
    g = rawGrains;
  else
    g = smoothBoundary(rawGrains,iter);
  end
  ab = polyfit(log(g.equivalentRadius),log(g.perimeter),1);
  fprintf('%2d smoothing iterations: fractal dimension %.3f\n',iter,ab(1));
end
0 smoothing iterations: fractal dimension 1.127
5 smoothing iterations: fractal dimension 1.010
25 smoothing iterations: fractal dimension 0.964The pixel staircase gives 1.127 because grid corners add artificial length. Five iterations give 1.010, while 25 iterations push the estimate to 0.964, below the range of a self-similar plane curve. That is a diagnostic that the estimator's assumptions have failed, not a physical property of the rock. Compare specimens only after matching the pixel resolution, grain-size cutoff, segmentation, and smoothing procedure.
Further reading
- ISO 13067:2020, Microbeam analysis - Electron backscatter diffraction - Measurement of average grain size. It distinguishes measurements on a two-dimensional section from inferences about three-dimensional grain size.
- R. Heilbronner and S. Barrett, Image Analysis in Earth Sciences: Microstructures and Textures of Earth Materials, Springer, 2014. The textbook develops two- and three-dimensional grain-size distributions together with particle and surface fabrics.
- B. B. Mandelbrot, How Long Is the Coast of Britain? Statistical Self-Similarity and Fractional Dimension, Science 156 (1967), 636-638. This paper explains why measured length depends on scale.
- M. Takahashi and H. Nagahama, The Sections' Fractal Dimension of Grain Boundary, Applied Surface Science 182 (2001), 297-301. It gives the perimeter-diameter construction used above for dynamically recrystallised quartz.
- S. E. Johnson et al., EBSD-Based Calibration of Differential Stress From Experimentally Deformed Black Hills Quartzite Using the Perimeter-Area Fractal Dimension, Journal of Geophysical Research: Solid Earth 130 (2025), e2024JB030866. The study tests pixel spacing, minimum grain size, and MTEX smoothing before calibration.
Next
Ellipse Based Shape Parameters replaces each grain by a moment-equivalent ellipse and introduces shape preferred orientation. Convex Hull Parameters isolates indentations, while Projection Parameters measures directional widths. Continue to Grain Boundaries when the segments and junctions, rather than whole-grain outlines, are the subject.
Citing this page.
This page is part of the documentation of
MTEX, a free and open
source MATLAB toolbox for analyzing and modeling crystallographic textures.
It was written by The MTEX Developers and is published at
https://mtex-toolbox.github.io/ShapeParameters.html.
If you use MTEX, or reuse text or figures from this page, in your research,
please cite
F. Bachmann, R. Hielscher, H. Schaeben: Texture Analysis with MTEX - Free and Open Source Software Toolbox, Solid State Phenomena 160 (2010), 63-68. 10.4028/www.scientific.net/SSP.160.63
BibTeX
@article{bachmann2010mtex,
  author  = {F. Bachmann and R. Hielscher and H. Schaeben},
  title   = {Texture Analysis with MTEX - Free and Open Source Software Toolbox},
  journal = {Solid State Phenomena},
  volume  = {160},
  pages   = {63-68},
  year    = {2010},
  doi     = {10.4028/www.scientific.net/SSP.160.63},
  url     = {https://doi.org/10.4028/www.scientific.net/SSP.160.63}
}
Other papers describing specific MTEX methods are listed under Publications — please cite the one that best fits your application. The MTEX source code is licensed under the GNU General Public License v2.0; the text and figures of this documentation are licensed under CC BY 4.0, which permits reuse — including by automated systems — provided The MTEX Developers and this page are credited.