
A spherical function can be evaluated, combined, searched, integrated, differentiated and rotated. The Concept page introduces their common S2Fun interface and evaluates one function at a chosen direction. This page builds on that step with two functions.
Two functions to compare
The examples use one patterned function and one narrow peak. Both are harmonic spherical functions and therefore support the same operations.
plottingConvention.default('y↑→x');

% a patterned function and one narrow peak
sF1 = S2Fun.smiley;
sF2 = S2FunHarmonic.unimodal('halfwidth',10*degree,sF1.how2plot);

newMtexFigure('layout',[1,2]);
plot(sF1,'upper')
mtexTitle('Patterned function')
nextAxis
plot(sF2,'upper')
mtexTitle('Narrow peak')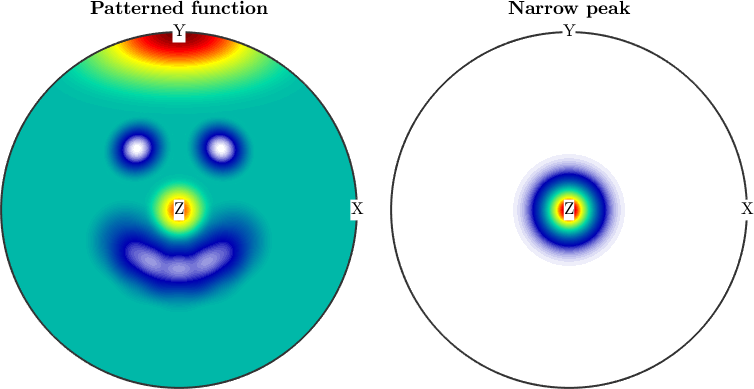
The first function has several broad features. The second concentrates its values around one direction. This contrast makes the effect of each operation visible.
Basic arithmetic
Adding functions or multiplying them by scalars produces another spherical function. Adding the constant one shifts every value equally.
combined = 15 * sF1 + sF2;
shifted = 1 + combined;

% check the shift at one direction
shiftAtX = shifted.eval(xvector) - combined.eval(xvector);
fprintf('Shift at specimen X: %.1f\n',shiftAtX)

plot(combined,'upper')
Shift at specimen X: 1.0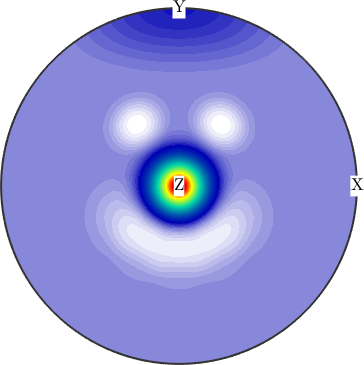
The combined plot retains the pattern of the first function and adds the sharp peak of the second. Even scaled by 15, the broad pattern stays faint, because the peak sets the top of the colour scale. The printed difference of 1.0 confirms that adding one shifts the value without changing the pattern.
Pointwise operations
The basic operations -, *, .^ and / also work with S2Fun objects. Functions such as min, max, abs and sqrt likewise return spherical functions when used pointwise.
For two functions, pointwise multiplication and division use .* and ./. Plain * scales a function, while sF / a divides it by a scalar.
newMtexFigure('layout',[1,2]);

% the maximum between two functions
plot(max(15*sF1,sF2),'upper')
mtexTitle('Pointwise maximum')

nextAxis

% the minimum between two functions
plot(min(15*sF1,sF2),'upper')
mtexTitle('Pointwise minimum')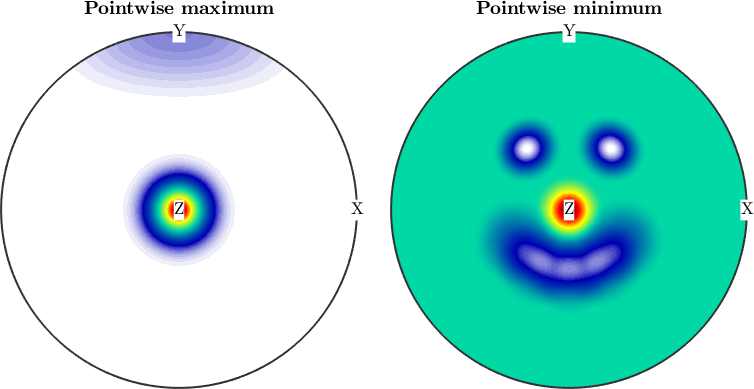
The pointwise maximum keeps whichever surface is higher at each direction. The pointwise minimum keeps the lower surface. The two plots therefore partition the same pair of functions in complementary ways.
Global and local extrema
min and max select their behaviour from their inputs:
- Two spherical functions produce their pointwise minimum or maximum.
- A spherical function and one number produce its pointwise minimum or maximum with that value.
- One spherical function returns its global minimum or maximum.
- The additional
'numLocal'option requests several local extrema.
As the Concept example shows, 'numLocal' is an upper limit rather than a promise that the requested number exists.
newMtexFigure;
plot(combined,'upper')

% compute and mark the global maximum
[maxValue,maxNodes] = max(combined);
annotate(maxNodes)

% compute and mark up to two local minima
[minValue,minNodes] = min(combined,'numLocal',2);
annotate(minNodes)

fprintf('Global maximum: %.3f; local minima: %.3f and %.3f\n',...
  maxValue,minValue(1),minValue(2))
Global maximum: 97.847; local minima: -7.465 and -7.465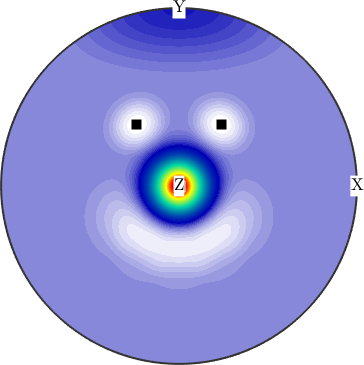
The maximum marker sits on the top of the narrow peak. The minimum markers identify the two eyes, separate basins instead of merely the lowest sampled pixels in the plot. The maximum is 97.847, while the two basins have equal minima of -7.465.
Integration and norms
sum returns the surface integral over the sphere. Thus the constant function one integrates to \(4\pi\). mean divides that integral by \(4\pi\), so the constant function one has mean value one. These two normalisations therefore give the same result for any function.
meanValue = mean(sF1);
normalisedIntegral = sum(sF1) / (4*pi);

fprintf('Mean: %.4f; integral/(4*pi): %.4f\n',...
  meanValue,normalisedIntegral)
Mean: 0.0064; integral/(4*pi): 0.0064Both values are 0.0064. This agreement checks the \(4\pi\) normalisation rather than asserting that sF1 itself is normalized to mean one.
Integration also defines the \(L^2\) norm of a spherical function \(f\):
\[\Vert f\Vert_2 = \left(\int_{\mathrm{sphere}} \vert f(\xi)\vert^2\,\mathrm d\xi\right)^{1/2}.\]
It can be assembled directly from the surface integral.
normFromIntegral = sqrt(sum(sF1.^2)); norm computes the same quantity more efficiently.
directNorm = norm(sF1);
fprintf('From integral: %.4f; norm: %.4f\n',...
  normFromIntegral,directNorm)
From integral: 0.4229; norm: 0.4229Both routes give 0.4229. The result is a single measure of the function's overall magnitude, not its maximum value.
Differentiation
The differential at one direction is the tangential gradient. MTEX returns it as a three-dimensional vector with grad.
gradientAtX = grad(sF1,xvector)
gradientMagnitude = norm(gradientAtX)
gradientAtX = vector3d (y↑→x)
x y z
0 -0.00023 -0.00119
gradientMagnitude =
0.0012The vector lies in the plane tangent to the sphere at X, so its X component is zero. Its magnitude of about \(10^{-3}\) is no feature of the smiley, which is flat around X, but the residue of expanding a function with sharp edges into harmonics of finite degree.
Gradients at all directions form a spherical vector field. Calling grad without an evaluation direction returns an S2VectorFieldHarmonic.
% compute the gradient as a vector field
G = grad(sF1);

% plot the gradient on top of the function
newMtexFigure;
plot(sF1,'upper')
hold on
plot(G)
hold off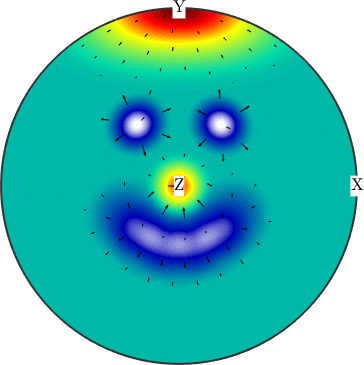
Long arrows mark large changes in intensity. Arrows become almost invisible where the function is nearly constant.
Rotate a function
rotate moves a spherical function by a specified rotation.
% define a rotation
rot = rotation.byAxisAngle(yvector,-30*degree);

% plot the rotated spherical function
newMtexFigure;
plot(rotate(combined,rot),'upper')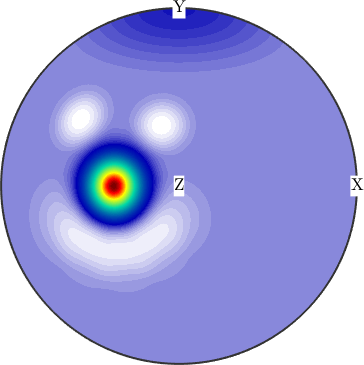
The entire pattern, including its maxima and minima, moves together by \(-30\) degrees about the \(y\) axis.
Symmetrise a function
A special case of rotation is symmetrising it with respect to some symmetry. The next example symmetrises the smiley with respect to a twofold axis in the \(z\) direction.
% define the symmetry
cs = crystalSymmetry('112');

% compute the symmetrised function
sFs = symmetrise(sF1,cs)

% plot it
newMtexFigure;
plot(sFs,'upper','complete')
sFs = S2FunHarmonic (y↑→x)
bandwidth: 128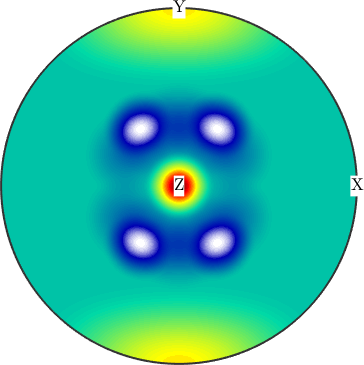
The result is an S2FunHarmonicSym and carries its symmetry. The complete plot shows that the original pattern has been repeated by the twofold symmetry operation.
close allReferences
- F. Bachmann, R. Hielscher and H. Schaeben, Texture Analysis with MTEX - Free and Open Source Software Toolbox, Solid State Phenomena 160, 63--68, 2010. This article connects MTEX spherical calculations to pole figures and orientation distributions.
Next
Continue with Plotting to choose a spherical projection, plot style, hemisphere and colour scale for these functions.
Citing this page.
This page is part of the documentation of
MTEX, a free and open
source MATLAB toolbox for analyzing and modeling crystallographic textures.
It was written by The MTEX Developers and is published at
https://mtex-toolbox.github.io/S2FunOperations.html.
If you use MTEX, or reuse text or figures from this page, in your research,
please cite
F. Bachmann, R. Hielscher, H. Schaeben: Texture Analysis with MTEX - Free and Open Source Software Toolbox, Solid State Phenomena 160 (2010), 63-68. 10.4028/www.scientific.net/SSP.160.63
BibTeX
@article{bachmann2010mtex,
  author  = {F. Bachmann and R. Hielscher and H. Schaeben},
  title   = {Texture Analysis with MTEX - Free and Open Source Software Toolbox},
  journal = {Solid State Phenomena},
  volume  = {160},
  pages   = {63-68},
  year    = {2010},
  doi     = {10.4028/www.scientific.net/SSP.160.63},
  url     = {https://doi.org/10.4028/www.scientific.net/SSP.160.63}
}
Other papers describing specific MTEX methods are listed under Publications — please cite the one that best fits your application. The MTEX source code is licensed under the GNU General Public License v2.0; the text and figures of this documentation are licensed under CC BY 4.0, which permits reuse — including by automated systems — provided The MTEX Developers and this page are credited.