
An orientation distribution function (ODF) is defined on the three-dimensional space of orientations. A section plot makes this space readable on a page by evaluating the ODF on several two-dimensional slices and placing the slices side by side. A section is not a projection: it does not integrate density from neighbouring orientations.
This page assumes the ODF normalization introduced in ODF Theory. Plotting an ODF compares sections with three-dimensional plots, pole figures, and inverse pole figures. The Bunge and Matthies angle conventions are introduced in Rotation Representations.
The plotting convention below draws specimen Y upward and X to the right. It changes only the screen layout, not the ODF or its reference frame.
plottingConvention.default('y↑→x');A Model with Known Features
The example combines the brass and copper components with the beta fibre. The coefficients 0.2, 0.3, and 0.5 are mixture fractions of normalized components. They are not the peak heights seen in a section.
cs = crystalSymmetry.load('Al-Aluminum.cif');

ori1 = orientation.brass(cs);
ori2 = orientation.copper(cs);
f = fibre.beta(cs);

odf = 0.2*unimodalODF(ori1) + ...
  0.3*unimodalODF(ori2) + ...
  0.5*fibreODF(f);
Default Bunge Sections
plotSection uses sections at constant third Bunge angle \(\varphi_2\) by default. Here the explicit 'phi2' flag makes that choice visible. The option 'sections' sets the number of panels; it does not set the angular resolution within a panel.
close all;
plotSection(odf,'phi2','sections',9,'silent','layout',[5 2],...
  'figSize','large');

annotate(ori1,'MarkerSize',15);
annotate(ori2,'Marker','v','MarkerSize',15);
plot(f,'LineWidth',2,'add2all');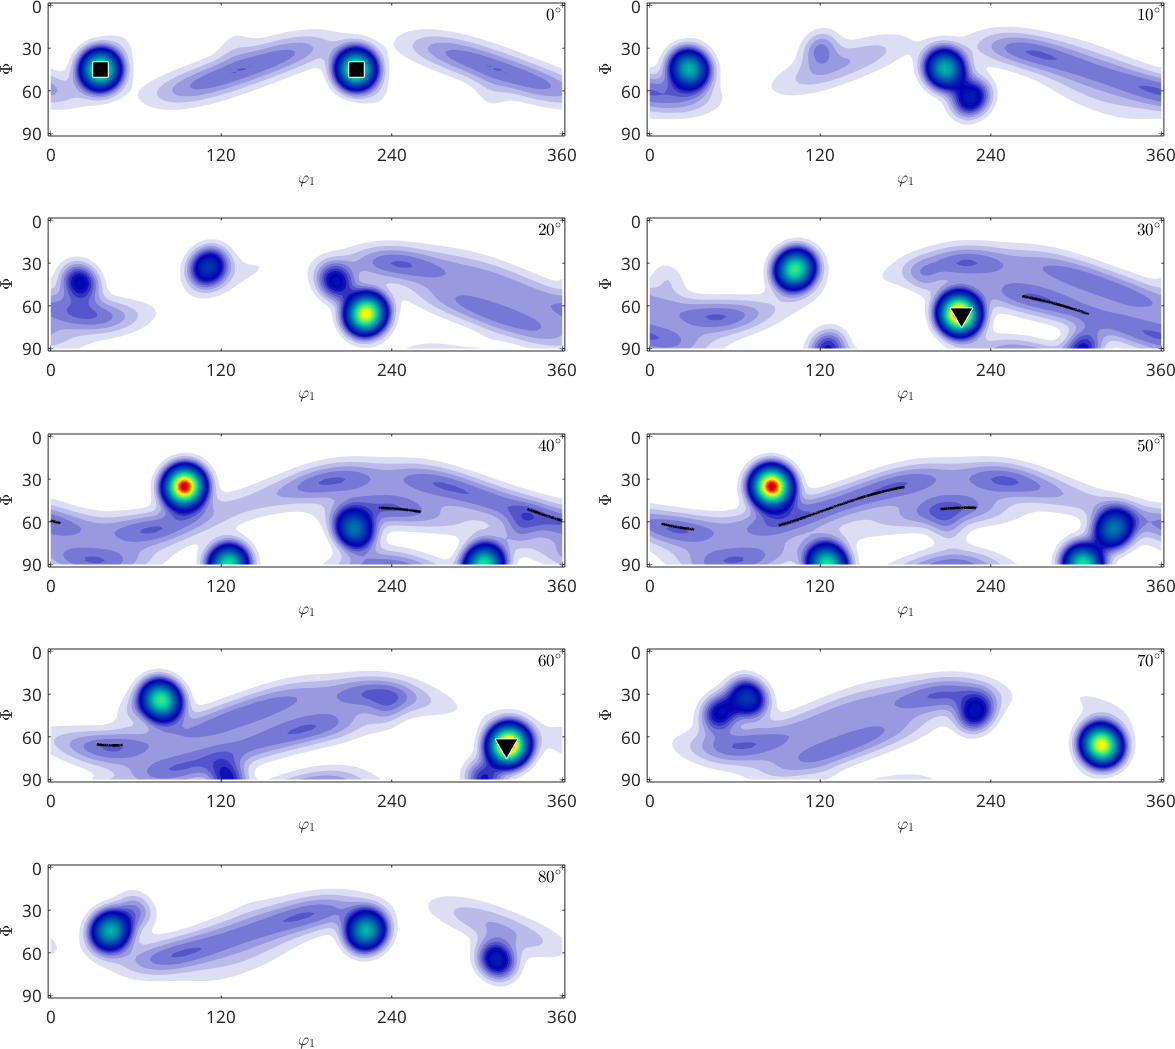
The square and triangle locate the brass and copper component centres. The line follows the beta fibre. A localized component is confined to nearby panels, whereas the fibre continues across a sequence of panels. The nine panels sample the available \(\varphi_2\) period without repeating its equivalent endpoint.
Choosing the Section Angles
Pass explicit angle values with an option named after the fixed coordinate. The following four panels restrict the display to \(\varphi_2=25^\circ\), \(30^\circ\), \(35^\circ\), and \(40^\circ\). Constructing phi2Sections explicitly records this geometry so it can be reused for several ODFs or orientation sets.
sectionAngles = [25 30 35 40]*degree;
oS = phi2Sections(odf.CS,odf.SS,'phi2',sectionAngles);

close all;
plotSection(odf,oS,'silent','figSize','large');
annotate(ori1,'MarkerSize',15);
annotate(ori2,'Marker','v','MarkerSize',15);
plot(f,'LineWidth',2,'add2all');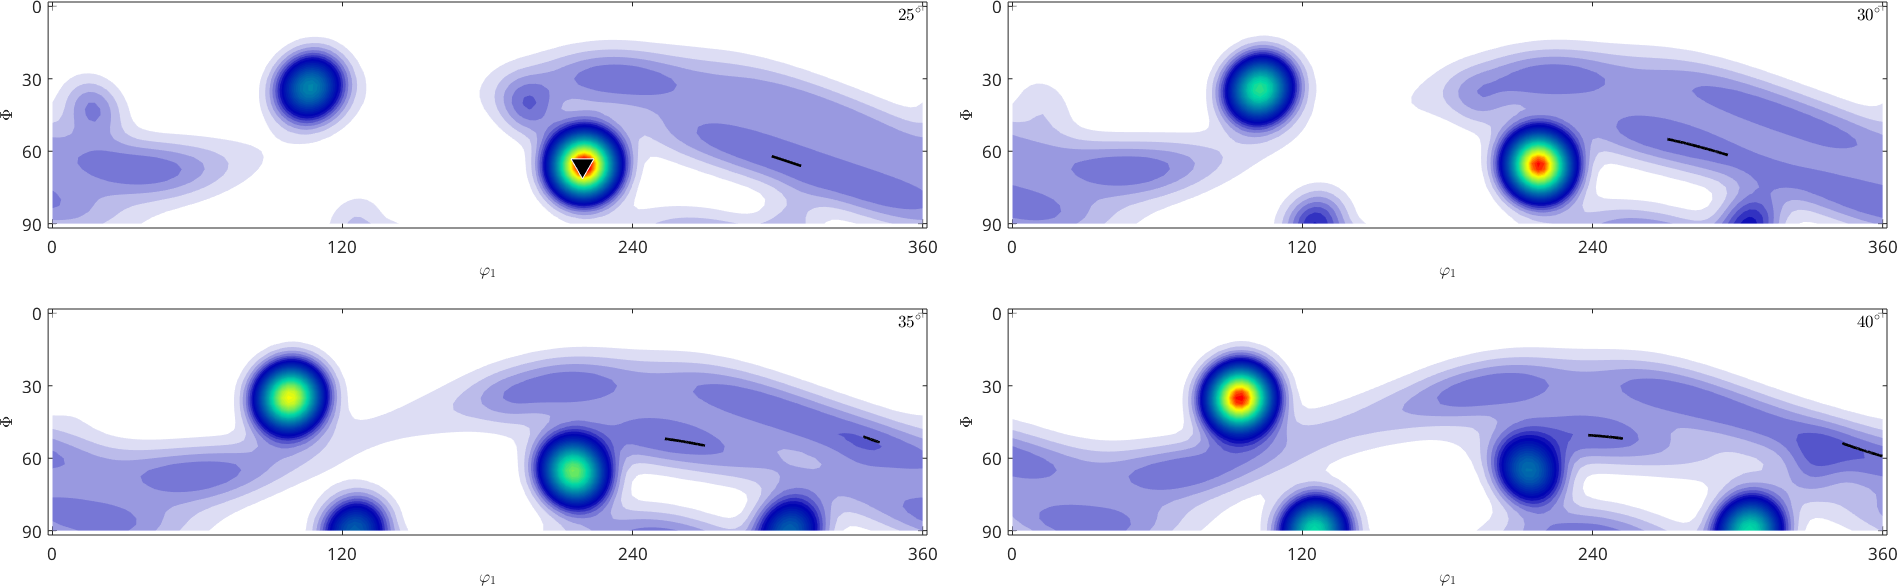
This restricted gallery resolves how the beta fibre passes through a narrow interval instead of spending space on the full period. Explicit values select slices; they do not average the ODF between those values.
Choosing a Section Family
MTEX can hold any Bunge or Matthies Euler coordinate constant. Each family uses its own option name for explicit section values.
|
flag |
fixed coordinate |
explicit values |
|
'phi2' |
third Bunge angle \(\varphi_2\) |
'phi2',values |
|
'phi1' |
first Bunge angle \(\varphi_1\) |
'phi1',values |
|
'Phi' |
second Bunge angle \(\Phi\) |
'Phi',values |
|
'gamma' |
Matthies angle \(\gamma\) |
'gamma',values |
|
'alpha' |
Matthies angle \(\alpha\) |
'alpha',values |
|
'sigma' |
Matthies coordinate \(\sigma=\alpha+\gamma\) |
'sigma',values |
The corresponding classes are phi2Sections, phi1Sections, PhiSections, gammaSections, alphaSections, and sigmaSections. They share layout, resolution, and the plot-type options. The 'secResolution' option is specific to phi2Sections and sets the spacing between its section angles.
Sigma Sections
Sigma sections are special. For the usual choice of reference axes, a position within a \(\sigma\) section is the specimen direction of the crystal axis \(\vec c^*\). The section angle describes the remaining rotation about that direction. A panel can therefore be read much like a pole figure with one extra angular coordinate.
MTEX defines the Matthies coordinate as \(\sigma=\alpha+\gamma\). Do not replace it by an informal expression in the Bunge angles; the coordinate conventions and reference fields matter.
close all;
plotSection(odf,'sigma','silent',...
  'figSize','large');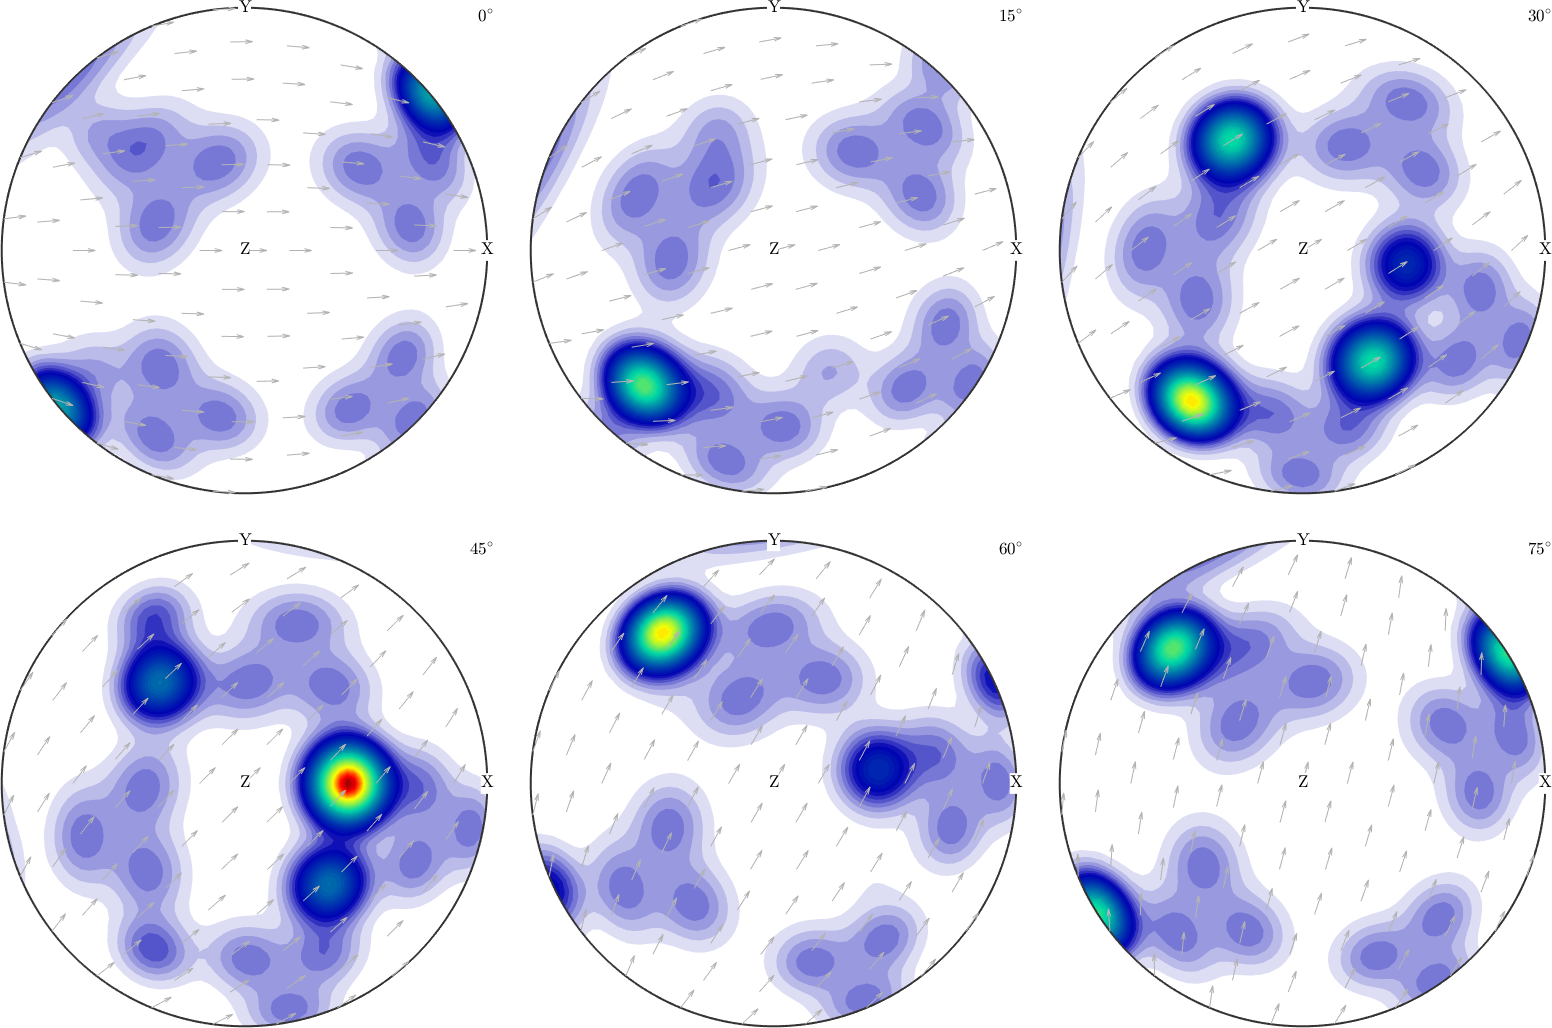
The same brass, copper, and fibre contributions are now arranged by the specimen direction of the crystal axis \(\vec c^*\) and by rotation about it. No density has been added or removed; only the coordinates of the slices have changed. Sigma Sections develops this geometric reading for crystals with a distinguished axis.
Other Euler Coordinates
Sections at constant first Bunge angle \(\varphi_1\) put \(\varphi_2\) and \(\Phi\) within each panel.
close all;
plotSection(odf,'phi1','sections',6,'layout',[3 2],'silent',...
  'figSize','large');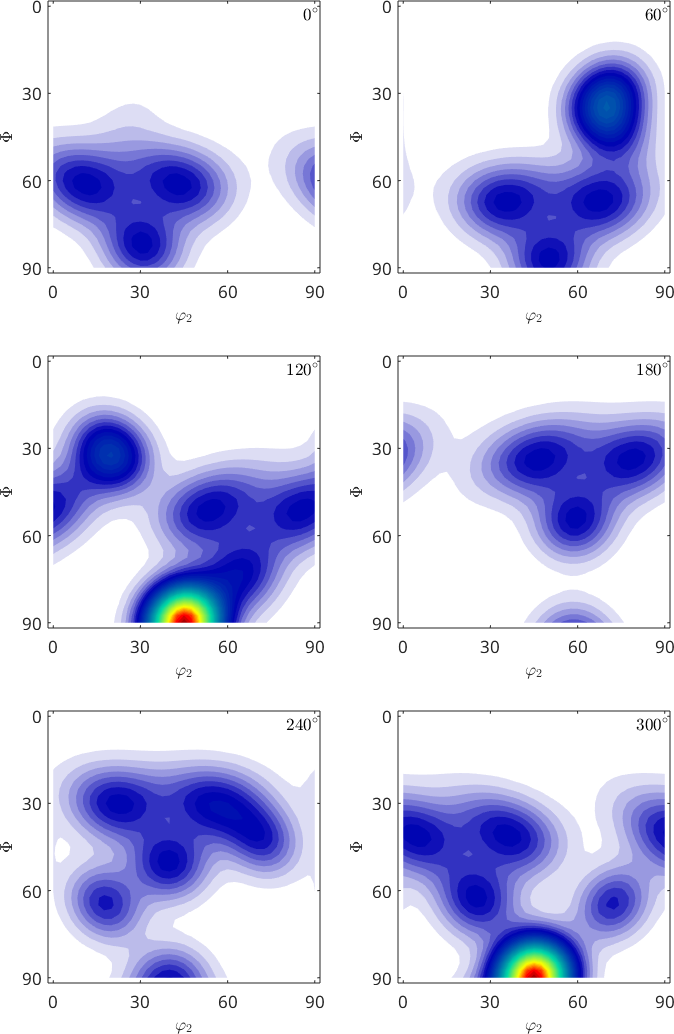
Features that were split mainly along \(\varphi_1\) in the default view now remain within one panel, while features extended along \(\varphi_1\) pass through several panels. This is the same ODF sampled on a different family of slices.
Sections at constant \(\gamma\) make the analogous choice in the Matthies convention.
close all;
plotSection(odf,'gamma','sections',6,'layout',[3 2],'silent',...
  'figSize','large');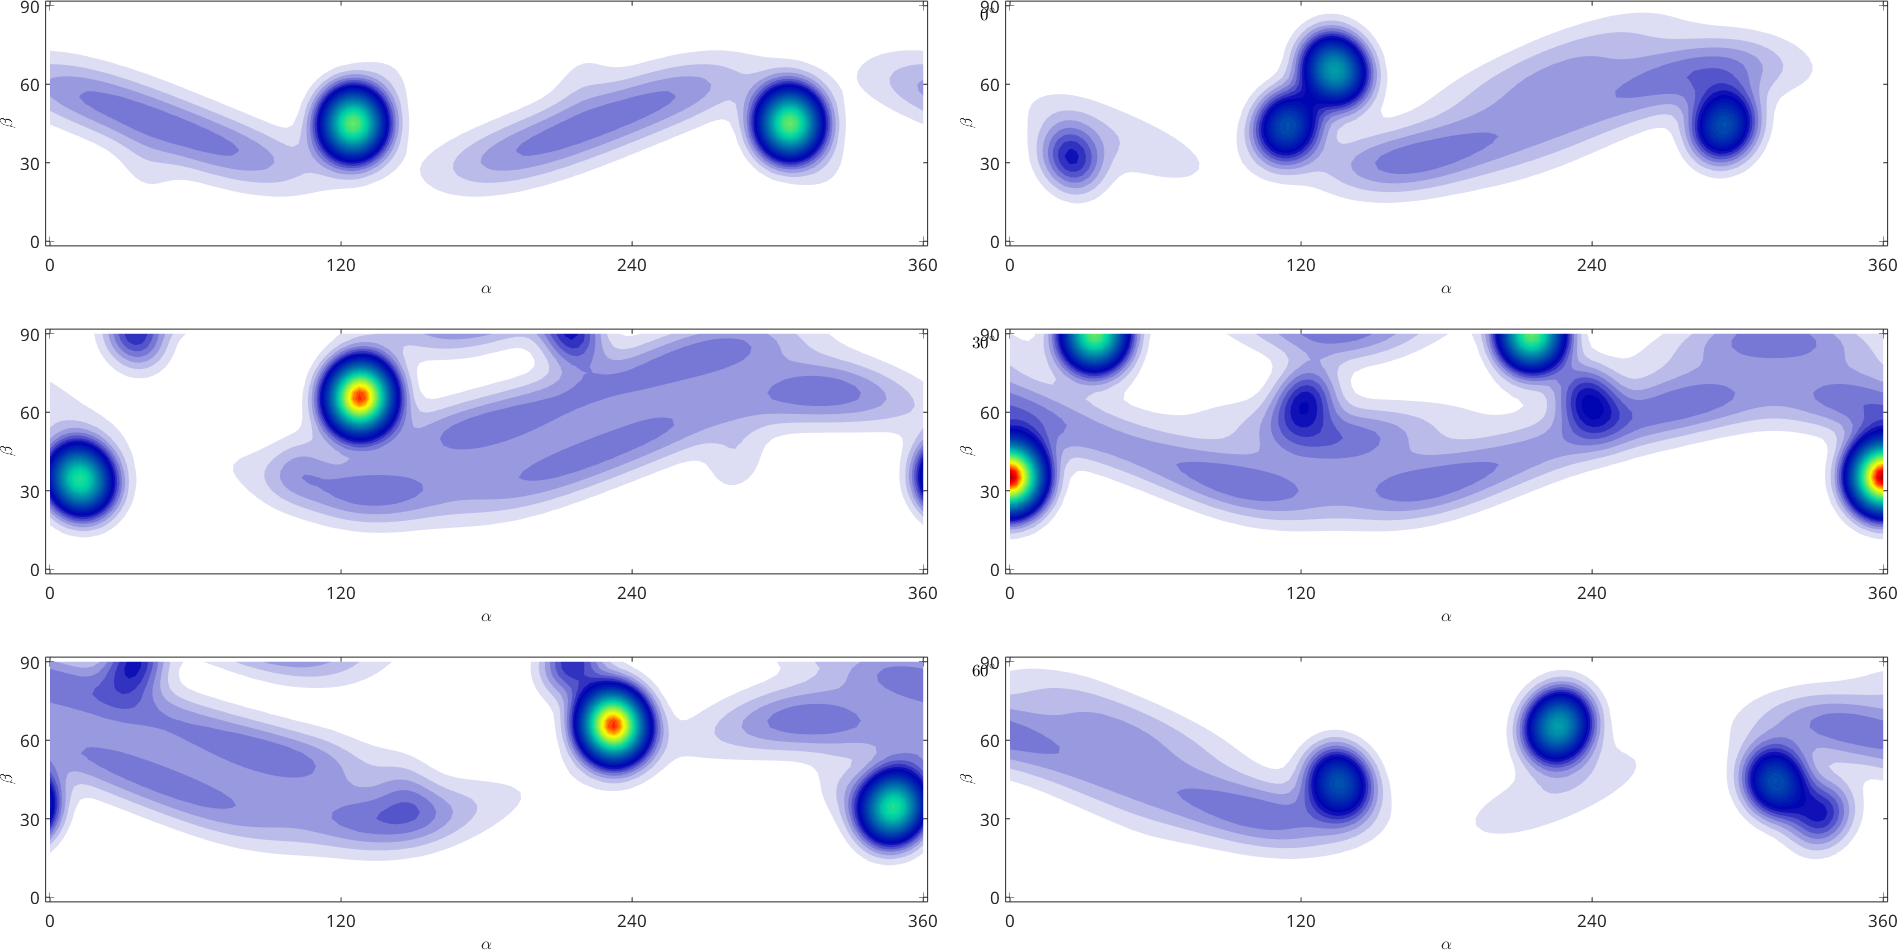
The panels again redistribute the same features. A useful family is the one that keeps the feature of interest compact and makes its relevant specimen or crystal direction easy to read. It is not a different ODF.
Euler Plotting Bounds and Crystal Symmetry
Bunge sections use the coordinates \(\varphi_1\), \(\Phi\), and \(\varphi_2\). With identity specimen symmetry, MTEX uses the following crystal-symmetry-dependent rectangular plotting bounds.
|
symmetry |
1 |
2 |
222 |
3 |
32 |
4 |
422 |
6 |
622 |
23 |
432 |
|
\(\varphi_1\) |
\(360^{\circ}\) |
\(360^{\circ}\) |
\(360^{\circ}\) |
\(360^{\circ}\) |
\(360^{\circ}\) |
\(360^{\circ}\) |
\(360^{\circ}\) |
\(360^{\circ}\) |
\(360^{\circ}\) |
\(360^{\circ}\) |
\(360^{\circ}\) |
|
\(\Phi\) |
\(180^{\circ}\) |
\(180^{\circ}\) |
\(90^{\circ}\) |
\(180^{\circ}\) |
\(90^{\circ}\) |
\(180^{\circ}\) |
\(90^{\circ}\) |
\(180^{\circ}\) |
\(90^{\circ}\) |
\(90^{\circ}\) |
\(90^{\circ}\) |
|
\(\varphi_2\) |
\(360^{\circ}\) |
\(180^{\circ}\) |
\(180^{\circ}\) |
\(120^{\circ}\) |
\(120^{\circ}\) |
\(90^{\circ}\) |
\(90^{\circ}\) |
\(60^{\circ}\) |
\(60^{\circ}\) |
\(180^{\circ}\) |
\(90^{\circ}\) |
Crystal symmetry does not restrict the first Euler angle. With identity specimen symmetry, \(\varphi_1\) therefore spans \(0^\circ\) through \(360^\circ\) for every crystal symmetry in the table. For point groups 23 and 432, this rectangular box does not account for the threefold axis. Each orientation consequently appears three times within the box.
fundamentalRegionEuler returns these upper bounds for an arbitrary pair of crystal and specimen symmetries. They describe a plotting box, not necessarily a compact fundamental region with exactly one representative. The latter is introduced in Fundamental Regions.
Specimen Symmetry
Specimen symmetry can restrict the first Euler angle. Orthotropic specimen symmetry reduces it to \(90^\circ\) for this cubic example and produces the common square-shaped ODF panels. Assigning a specimen symmetry changes the symmetry used to represent the function; it does not rotate the texture or change its specimen reference frame. See Specimen Symmetry before applying such a symmetry to measured data. A classical gallery at \(5^\circ\) intervals can be requested with 'sections',18. Six panels are sufficient here to show the changed bounds while keeping this executable page practical.
odfOrtho = odf;
odfOrtho.SS = specimenSymmetry('222');

[maxPhi1,maxPhi,maxPhi2] = ...
  fundamentalRegionEuler(odfOrtho.CS,odfOrtho.SS);
eulerBounds = [maxPhi1,maxPhi,maxPhi2] ./ degree

close all;
plotSection(odfOrtho,'phi2','sections',6,'layout',[3 2],...
  'coordinates','off','xlabel','','ylabel','','silent',...
  'figSize','large');
eulerBounds =
90 90 90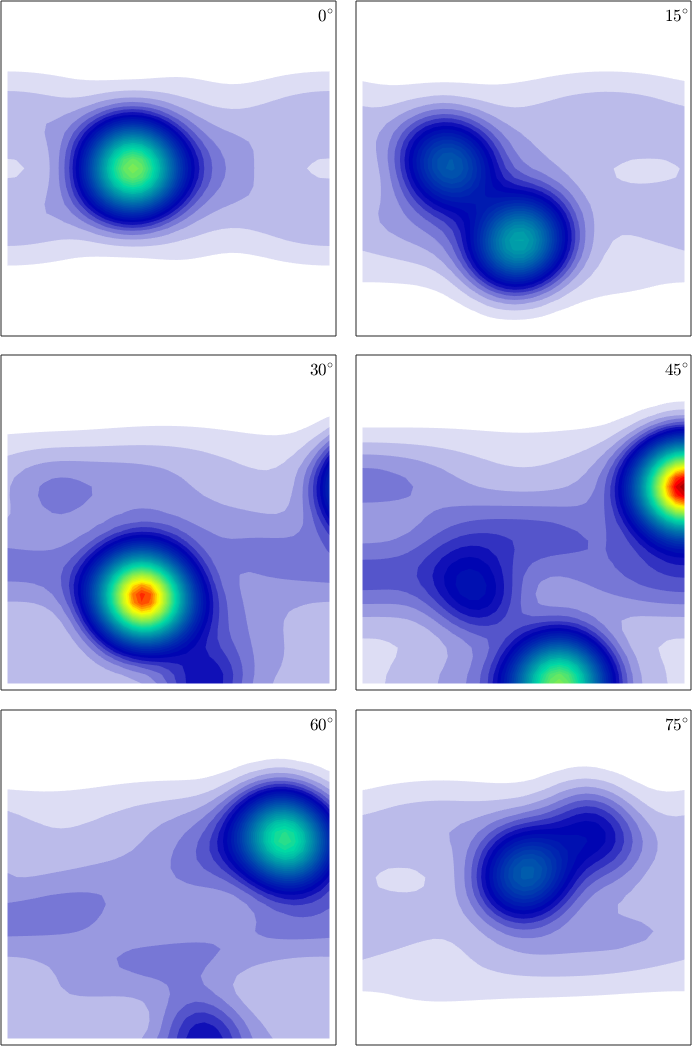
The displayed bounds are \(90^\circ\) by \(90^\circ\) by \(90^\circ\). Accordingly, every panel is square, whereas the panels above spanned \(360^\circ\) in \(\varphi_1\). Specimen symmetry has restricted \(\varphi_1\) only; the \(\varphi_2\) period is unchanged, so the six panels still sample it from \(0^\circ\) to \(90^\circ\).
Further Reading
- H.-J. Bunge, Texture Analysis in Materials Science: Mathematical Methods, Butterworths, English ed., 1982, develops the Bunge Euler convention, ODFs, and classical sections.
- A. Morawiec, Orientations and Rotations: Computations in Crystallographic Textures, Springer, 2004, treats rotation parametrizations and symmetry-reduced domains.
- S. Matthies, K. Helming, and K. Kunze, On the Representation of Orientation Distributions in Texture Analysis by Sigma-Sections. I, physica status solidi (b) 157 (1990), 71--83, introduces sigma sections. Part II, 489--507, develops crystal and specimen symmetry and worked examples.
Next
Sigma Sections explains how to interpret and customize sigma sections. The projections that integrate an ODF are Pole Figures and Inverse Pole Figures.
Citing this page.
This page is part of the documentation of
MTEX, a free and open
source MATLAB toolbox for analyzing and modeling crystallographic textures.
It was written by The MTEX Developers and is published at
https://mtex-toolbox.github.io/EulerAngleSections.html.
If you use MTEX, or reuse text or figures from this page, in your research,
please cite
F. Bachmann, R. Hielscher, H. Schaeben: Texture Analysis with MTEX - Free and Open Source Software Toolbox, Solid State Phenomena 160 (2010), 63-68. 10.4028/www.scientific.net/SSP.160.63
BibTeX
@article{bachmann2010mtex,
  author  = {F. Bachmann and R. Hielscher and H. Schaeben},
  title   = {Texture Analysis with MTEX - Free and Open Source Software Toolbox},
  journal = {Solid State Phenomena},
  volume  = {160},
  pages   = {63-68},
  year    = {2010},
  doi     = {10.4028/www.scientific.net/SSP.160.63},
  url     = {https://doi.org/10.4028/www.scientific.net/SSP.160.63}
}
Other papers describing specific MTEX methods are listed under Publications — please cite the one that best fits your application. The MTEX source code is licensed under the GNU General Public License v2.0; the text and figures of this documentation are licensed under CC BY 4.0, which permits reuse — including by automated systems — provided The MTEX Developers and this page are credited.