
A polycrystal has no single-crystal stiffness tensor. Each measurement has an orientation that rotates its phase tensor into the specimen frame. The aggregate response also depends on how stress and strain are shared.
Even with phase tensors and orientations, this information determines bounds rather than a unique effective stiffness. This page computes the Voigt, Reuss, and Hill estimates from EBSD measurements and from an ODF.
Read Tensor Definition first for tensor rank and crystal frames. Tensor Arithmetics explains how an orientation rotates a tensor into the specimen frame.
plottingConvention.default('y↑→x');

ebsd = mtexdata('epidote');

% show the part of the map used to illustrate the cleaning step
plot(ebsd(inpolygon(ebsd,[2000 0 1400 375])));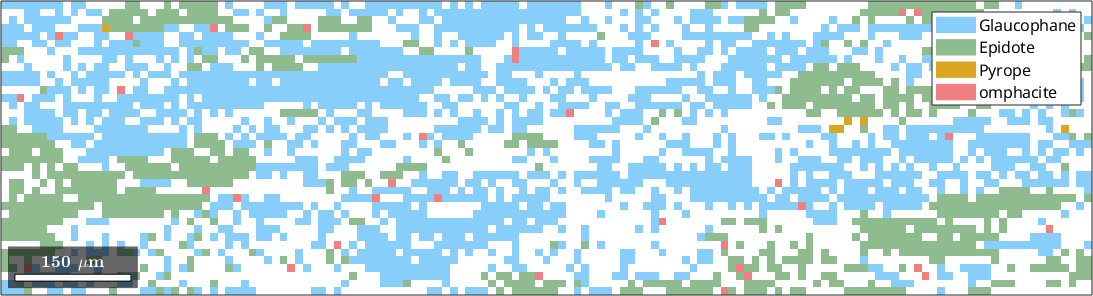
Remove poorly fitted measurements
The mean angular deviation (MAD) measures the fit between an indexed diffraction pattern and its solution. Here measurements above 1.3 degrees are removed before their orientations can enter the average.
MAD_MAXIMUM = 1.3;
ebsd(ebsd.mad > MAD_MAXIMUM) = [];

plot(ebsd(inpolygon(ebsd,[2000 0 1400 375])));

%
% Compare this map with the first one. Small blank patches mark removed
% measurements, while the phase colours of retained measurements are unchanged.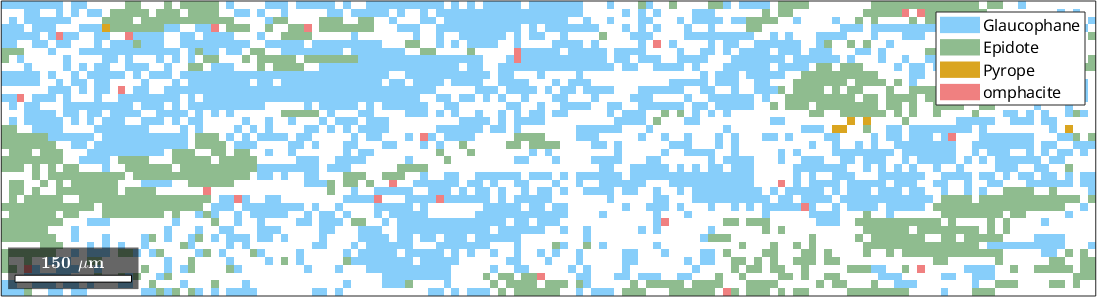
Define the single-crystal stiffness tensors
Every selected phase needs a stiffness tensor expressed in its published crystal frame. The 'Xa*','Zc' alignment is therefore part of the material data, not a plotting choice.
The glaucophane coefficients and density are from L. Bezacier et al., Elasticity of glaucophane, seismic velocities and anisotropy of the subducted oceanic crust, Tectonophysics 494 (2010), 201-210.
CS_Tensor_glaucophane = crystalSymmetry('2/m',[9.5334,17.7347,5.3008],...
  [90.00,103.597,90.00]*degree,'X||a*','Z||c',...
  'mineral','Glaucophane');

rho_glaucophane = 3.07;

% coefficients C_ij in Voigt matrix notation, in GPa
Cij = [[122.28   45.69   37.24   0.00   2.35   0.00];...
  [  45.69  231.50   74.91   0.00  -4.78   0.00];...
  [  37.24   74.91  254.57   0.00 -23.74   0.00];...
  [   0.00    0.00    0.00  79.67   0.00   8.89];...
  [   2.35   -4.78  -23.74   0.00  52.82   0.00];...
  [   0.00    0.00    0.00   8.89   0.00  51.24]];

C_glaucophane = stiffnessTensor(Cij,CS_Tensor_glaucophane,...
  'density',rho_glaucophane);

%
% The epidote coefficients are from K.S. Aleksandrov et al., _Velocities of
% elastic waves in minerals at atmospheric pressure and increasing the
% precision of elastic constants by means of EVM_ (in Russian),
% _Izv. Acad. Sci. USSR, Geol. Ser._ 10 (1974), 15-24.

CS_Tensor_epidote = crystalSymmetry('2/m',[8.8877,5.6275,10.1517],...
  [90.00,115.383,90.00]*degree,'X||a*','Z||c','mineral','Epidote');

rho_epidote = 3.45;

Cij = [[211.50    65.60    43.20     0.00     -6.50     0.00];...
  [  65.60   239.00    43.60     0.00    -10.40     0.00];...
  [  43.20    43.60   202.10     0.00    -20.00     0.00];...
  [   0.00     0.00     0.00    39.10      0.00    -2.30];...
  [  -6.50   -10.40   -20.00     0.00     43.40     0.00];...
  [   0.00     0.00     0.00    -2.30      0.00    79.50]];

C_epidote = stiffnessTensor(Cij,CS_Tensor_epidote,...
  'density',rho_epidote);

%
% <stiffnessTensor.stiffnessTensor.html |stiffnessTensor|> records the unit,
% crystal frame, and density with each coefficient array.
Average the EBSD measurements
This example selects only epidote and glaucophane. Each retained pixel has equal weight, so a phase contribution is proportional to its mapped area.
ebsdAggregate = ebsd({'Epidote','Glaucophane'});

phaseFractions = array2table(...
  [length(ebsdAggregate('Epidote')),length(ebsdAggregate('Glaucophane'))] ...
  ./ length(ebsdAggregate),...
  'VariableNames',{'Epidote','Glaucophane'})

%
% <EBSD.calcTensor.html |calcTensor|> matches each phase to a compatible
% tensor by the attached symmetry and lattice parameters. The argument order
% does not define that mapping. MTEX then rotates every tensor into the
% specimen frame, the reference frame of the map, and averages the pixels.

[CVoigt,CReuss,CHill] = calcTensor(ebsdAggregate,...
  C_glaucophane,C_epidote);

aggregateModuliValues = ...
  [CVoigt.bulkModulus,CReuss.bulkModulus,CHill.bulkModulus;...
   CVoigt.shearModulus,CReuss.shearModulus,CHill.shearModulus];

aggregateModuli = array2table(aggregateModuliValues,...
  'VariableNames',{'Voigt','Reuss','Hill'},...
  'RowNames',{'bulk modulus (GPa)','shear modulus (GPa)'})

%
% The bulk estimates are 103.6, 94.4, and 99.0 GPa. The shear estimates are
% 66.5, 60.9, and 63.7 GPa. These are scalar summaries of the three
% anisotropic aggregate stiffness tensors.

newMtexFigure;
bar(aggregateModuliValues);
set(gca,'XTickLabel',{'bulk','shear'});
ylabel('modulus (GPa)');
legend({'Voigt','Reuss','Hill'},'Location','best');

%
% In both groups the Reuss bar is lower and the Voigt bar is upper. The Hill
% bar lies halfway between them by definition.
phaseFractions =
1×2 table
Epidote Glaucophane
_______ ___________
0.2466 0.7534
aggregateModuli =
2×3 table
Voigt Reuss Hill
______ ______ ______
bulk modulus (GPa) 103.58 94.399 98.991
shear modulus (GPa) 66.525 60.891 63.708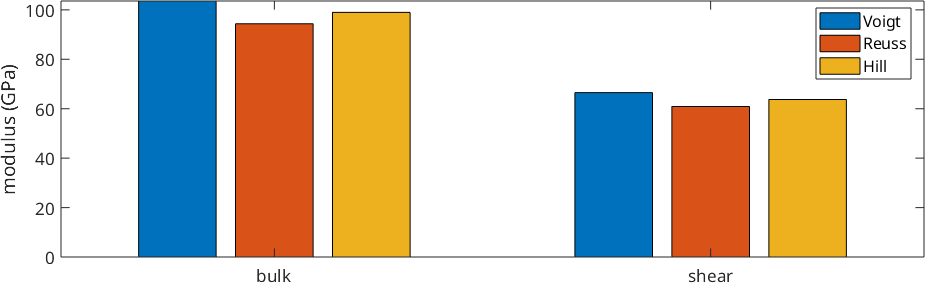
Average one phase
A single-phase calculation uses the same API with one stiffness tensor. Separate names preserve these results for comparison with the ODF average.
[CVoigt_glaucophane_ebsd,CReuss_glaucophane_ebsd,...
  CHill_glaucophane_ebsd] = calcTensor(...
  ebsd('Glaucophane'),C_glaucophane);
Average an ODF
Spatial positions are not required once the orientations have been reduced to an orientation distribution function (ODF). The 'halfwidth' controls the smoothing used by calcDensity.
odf_glaucophane = calcDensity(ebsd('Glaucophane').orientations,...
  'halfwidth',10*degree,'silent');

[CVoigt_glaucophane_odf,CReuss_glaucophane_odf,...
  CHill_glaucophane_odf] = calcTensor(odf_glaucophane,C_glaucophane);

glaucophaneBulkValues = ...
  [CVoigt_glaucophane_ebsd.bulkModulus,...
   CVoigt_glaucophane_odf.bulkModulus;...
   CReuss_glaucophane_ebsd.bulkModulus,...
   CReuss_glaucophane_odf.bulkModulus;...
   CHill_glaucophane_ebsd.bulkModulus,...
   CHill_glaucophane_odf.bulkModulus];

glaucophaneBulkModuli = array2table(glaucophaneBulkValues,...
  'VariableNames',{'EBSD','ODF'},...
  'RowNames',{'Voigt','Reuss','Hill'})

%
% The Voigt bulk modulus is 102.7 GPa by both routes. The Reuss value changes
% from 92.1 GPa for the measurements to 91.7 GPa for the smoothed ODF.
% This agreement is a consistency check, not a validation of the averaging
% assumptions.
%
% The ODF route also applies when orientations come from pole figures rather
% than a map. For a multiphase aggregate, average each phase ODF separately
% and then combine the tensors with independently justified volume fractions.
glaucophaneBulkModuli =
3×2 table
EBSD ODF
______ ______
Voigt 102.67 102.67
Reuss 92.125 91.72
Hill 97.397 97.195Use the aggregate tensor
An averaged stiffness tensor predicts elastic wave propagation through the aggregate. plotSeismicVelocities maps several velocities and polarizations.
plotSeismicVelocities(CHill_glaucophane_odf);

%
% Read the upper-left panel first. The P-wave velocity ranges from 6.89 to
% 8.38 km/s, and the labelled anisotropy is 19.5 percent. The fastest and
% slowest propagation directions are different because the measured
% glaucophane orientations are not uniformly distributed.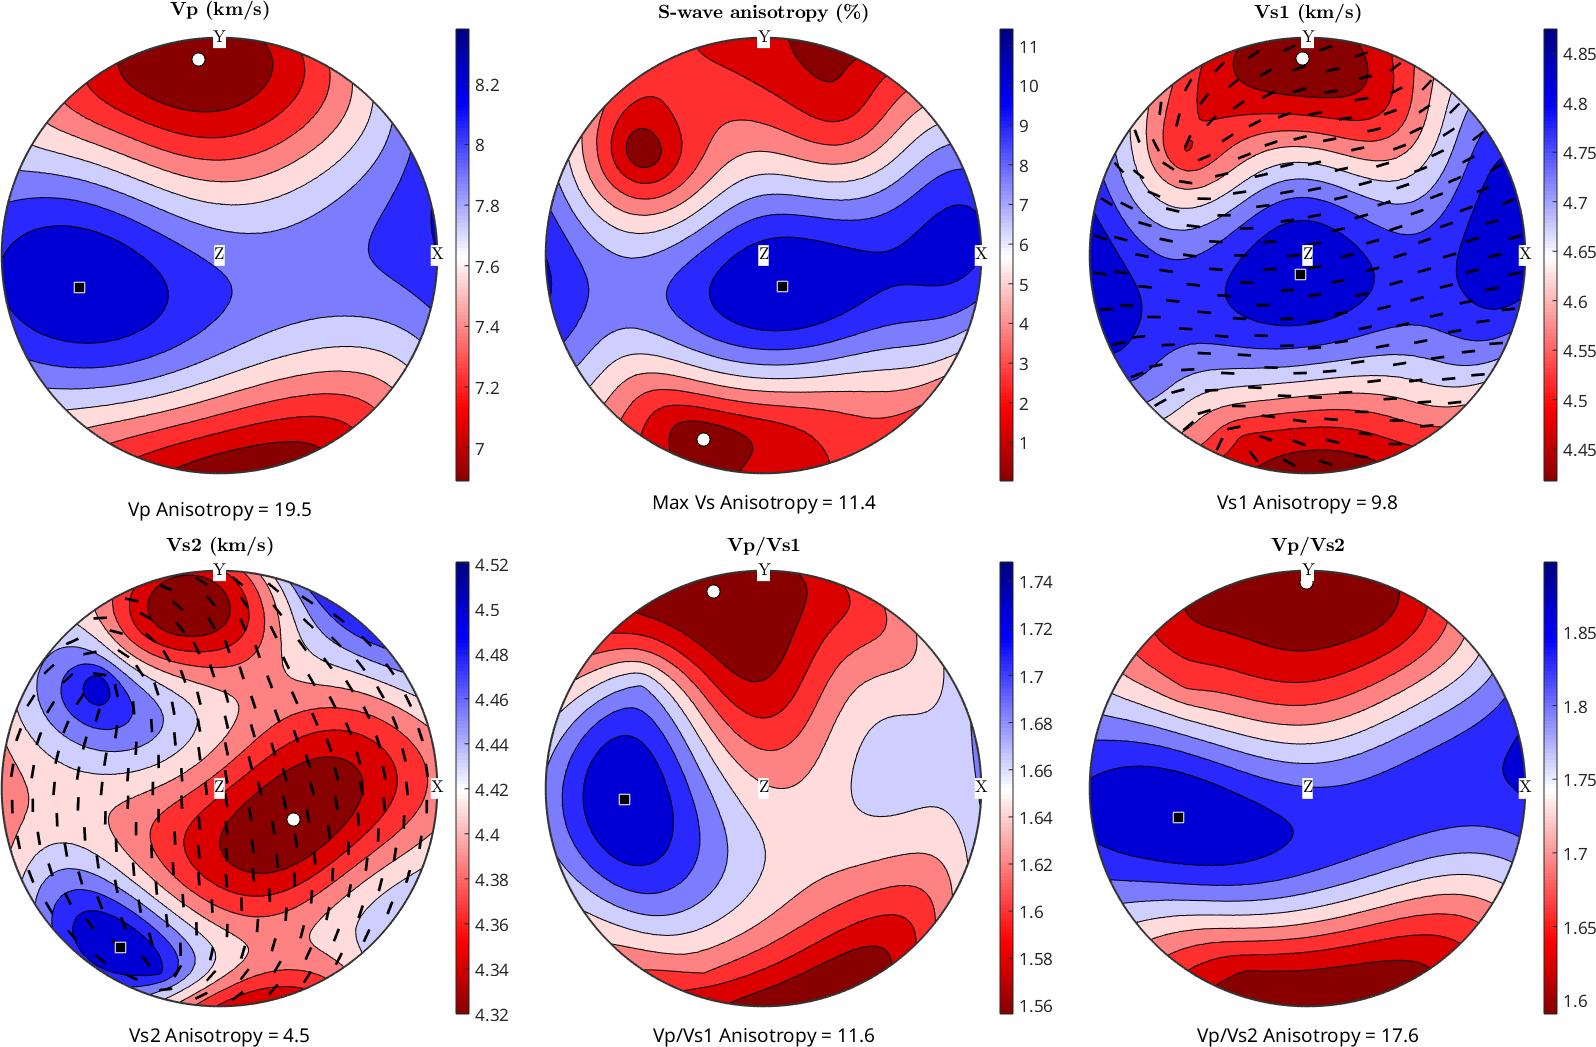
What these estimates leave out
Pixel weighting makes mapped area fraction stand in for volume fraction. That is justified only when the section and sampled area represent the material. It is not an equal-grain average.
Voigt and Reuss use phase fractions, orientations, and single-crystal tensors. They do not use grain shape, spatial arrangement, porosity, or grain-boundary mechanics. An ODF removes the spatial information entirely.
The gap between the bounds can reflect single-crystal anisotropy, phase stiffness contrast, and phase proportions. A multiphase aggregate can have a gap even when every phase is isotropic. Hill is an estimate inside the bounds, not another rigorous bound.
The maths behind the averages
Let \(C_m^{s}\) be the stiffness tensor for measurement \(m\) after its orientation rotates it into the specimen frame. Let normalized weights \(w_m\) satisfy \(\sum_m w_m=1\). The Voigt estimate averages stiffness:
\[ \overline{C}_{V}=\sum_{m=1}^{M}w_m C_m^{s}. \]
It assumes uniform strain. The Reuss estimate averages compliance and then inverts the result:
\[ \overline{C}_{R}=\left(\sum_{m=1}^{M}w_m \left(C_m^{s}\right)^{-1}\right)^{-1}. \]
It assumes uniform stress. Under linear elasticity these two assumptions give upper and lower energy bounds on the effective stiffness. Neither field can generally satisfy both stress equilibrium and strain compatibility at every grain boundary.
The Hill estimate is their arithmetic mean:
\[ \overline{C}_{H}=\frac{1}{2} \left(\overline{C}_{V}+\overline{C}_{R}\right). \]
Next
CPO Seismic Properties continues with several mineral phases, modal fractions, and aggregate seismic plots. Here CPO means crystallographic preferred orientation. Isotropic Theory introduces the tighter Hashin-Shtrikman bounds when their additional assumptions are appropriate. ODFs explains how an orientation distribution is built.
Further reading
- W. Voigt, Lehrbuch der Kristallphysik, 1910, gives the uniform-strain construction.
- A. Reuss, Berechnung der Fliessgrenze von Mischkristallen auf Grund der Plastizitaetsbedingung fuer Einkristalle, ZAMM 9 (1929), 49-58, gives the uniform-stress construction.
- R. Hill, The Elastic Behaviour of a Crystalline Aggregate, Proceedings of the Physical Society A 65 (1952), 349-354, establishes the bounds and discusses their mean.
- D. Mainprice, R. Hielscher, and H. Schaeben, Calculating anisotropic physical properties from texture data using the MTEX open-source package, Geological Society, London, Special Publications 360 (2011), 175-192.
- ASTM E562-19e1, Standard Test Method for Determining Volume Fraction by Systematic Manual Point Count, states the stereological conditions behind estimating volume fraction from a representative two-dimensional section.
Citing this page.
This page is part of the documentation of
MTEX, a free and open
source MATLAB toolbox for analyzing and modeling crystallographic textures.
It was written by The MTEX Developers and is published at
https://mtex-toolbox.github.io/TensorAverage.html.
If you use MTEX, or reuse text or figures from this page, in your research,
please cite
F. Bachmann, R. Hielscher, H. Schaeben: Texture Analysis with MTEX - Free and Open Source Software Toolbox, Solid State Phenomena 160 (2010), 63-68. 10.4028/www.scientific.net/SSP.160.63
BibTeX
@article{bachmann2010mtex,
  author  = {F. Bachmann and R. Hielscher and H. Schaeben},
  title   = {Texture Analysis with MTEX - Free and Open Source Software Toolbox},
  journal = {Solid State Phenomena},
  volume  = {160},
  pages   = {63-68},
  year    = {2010},
  doi     = {10.4028/www.scientific.net/SSP.160.63},
  url     = {https://doi.org/10.4028/www.scientific.net/SSP.160.63}
}
Other papers describing specific MTEX methods are listed under Publications — please cite the one that best fits your application. The MTEX source code is licensed under the GNU General Public License v2.0; the text and figures of this documentation are licensed under CC BY 4.0, which permits reuse — including by automated systems — provided The MTEX Developers and this page are credited.