
MTEX manages multiple axes through mtexFigure. It keeps their sizes and spacing consistent. It also coordinates figure-wide tools such as colour ranges and colorbars.
Commands such as plotPDF over several lattice planes, or plot of an ODF in sections, create this kind of figure automatically. To build one by hand, newMtexFigure creates the figure and its layout. The two entries of 'layout' are the number of rows and columns.
mtexFig = newMtexFigure('layout',[2,3],'figSize','normal');
plottingConvention.default('y↑→x');
plot(vector3d(1,1,1),'upper','MarkerSize',8)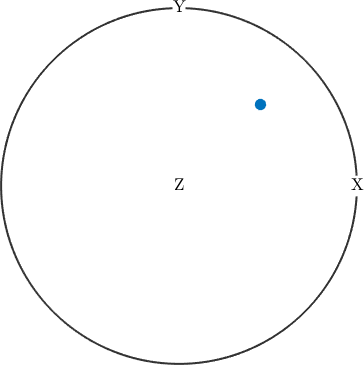
The first direction occupies the upper-left position of the fixed grid.
Fill the axes in sequence
nextAxis without an argument selects the next free axis. The fixed layout fills from left to right and then from top to bottom.
nextAxis

plot(vector3d(-1,1,1),'upper','MarkerSize',8)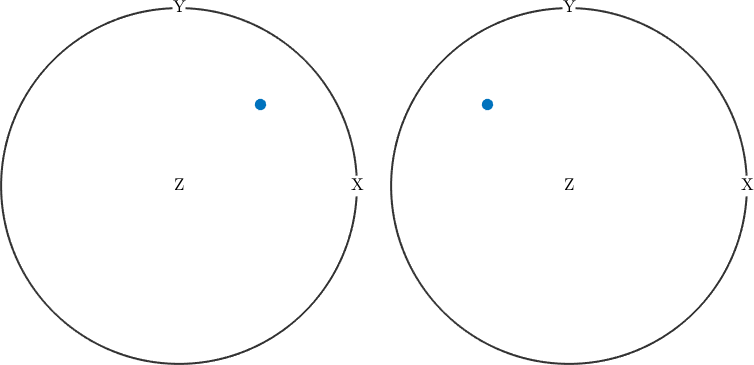
The second direction appears beside the first one in the upper row.
Select an axis by row and column
Two arguments select a particular row and column. This makes it possible to fill the layout in any order and to leave positions empty.
nextAxis(2,3)

plot(vector3d.rand(200),'upper')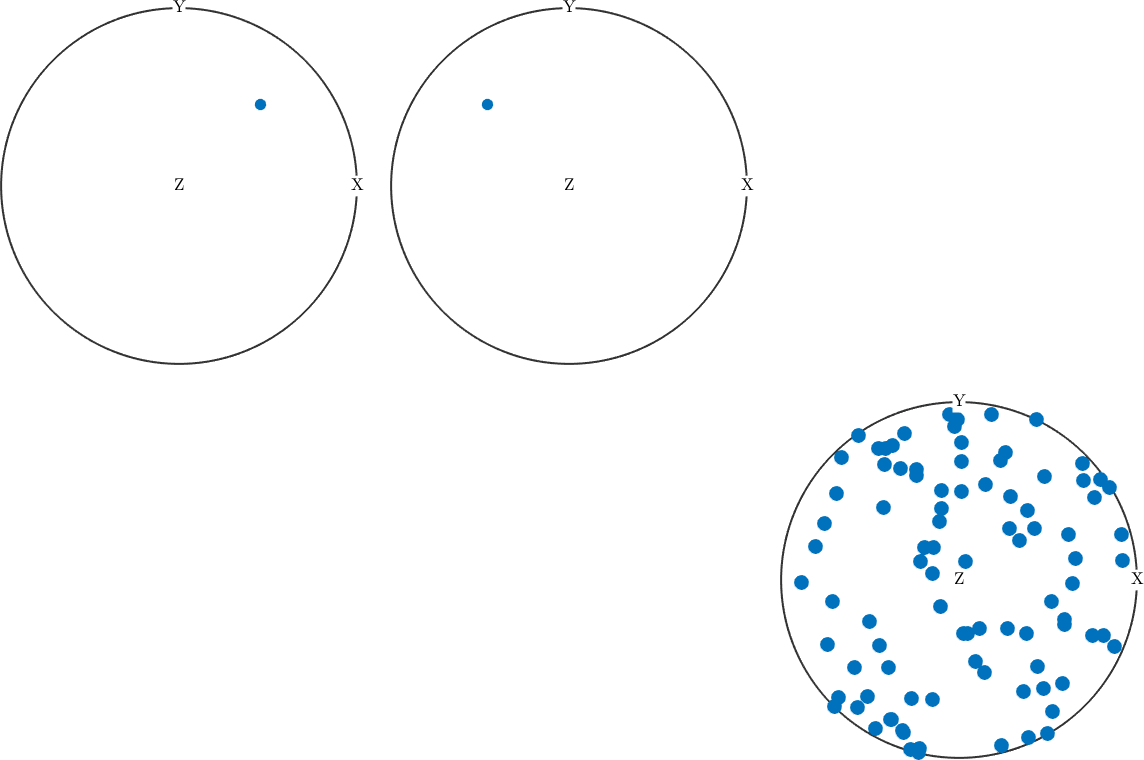
The cloud appears in the lower-right position. The unused upper-right and lower-middle positions remain empty.
Return to an occupied axis
Calling nextAxis for an occupied position selects that axis again. The next plot command repaints that one cell and leaves the rest of the arrangement untouched. Add hold on to draw on top of what the cell already holds.
nextAxis(2,3)

plot(vector3d(1,-1,1),'upper','MarkerSize',8)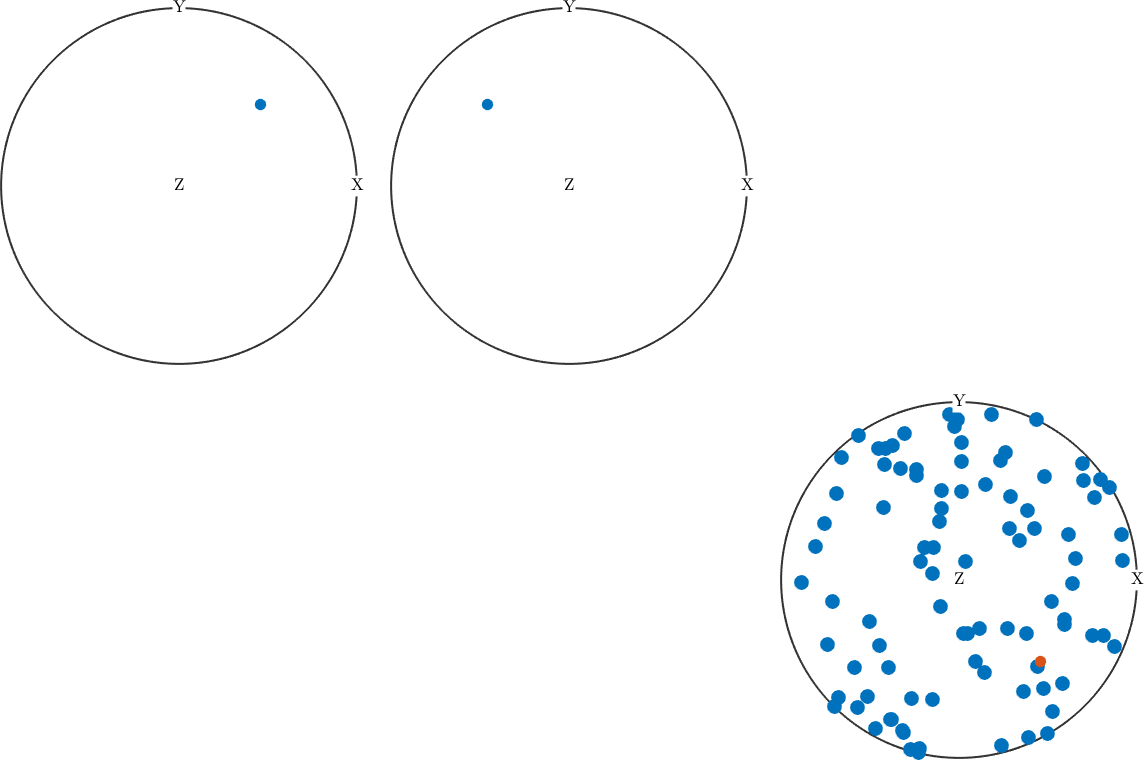
The single direction has taken the place of the random cloud, and the 2-by-3 arrangement is unchanged. Keep 'upper' when revisiting an upper-hemisphere axis. A full-sphere plot needs separate upper- and lower-hemisphere axes. It therefore changes the arrangement rather than converting this one axis in place.
Mix different kinds of plot
The axes need not contain the same kind of object. Here the lower-left axis shows the symmetry elements of a cubic crystal beside spherical plots of directions.
nextAxis(2,1)

plot(crystalSymmetry('432'))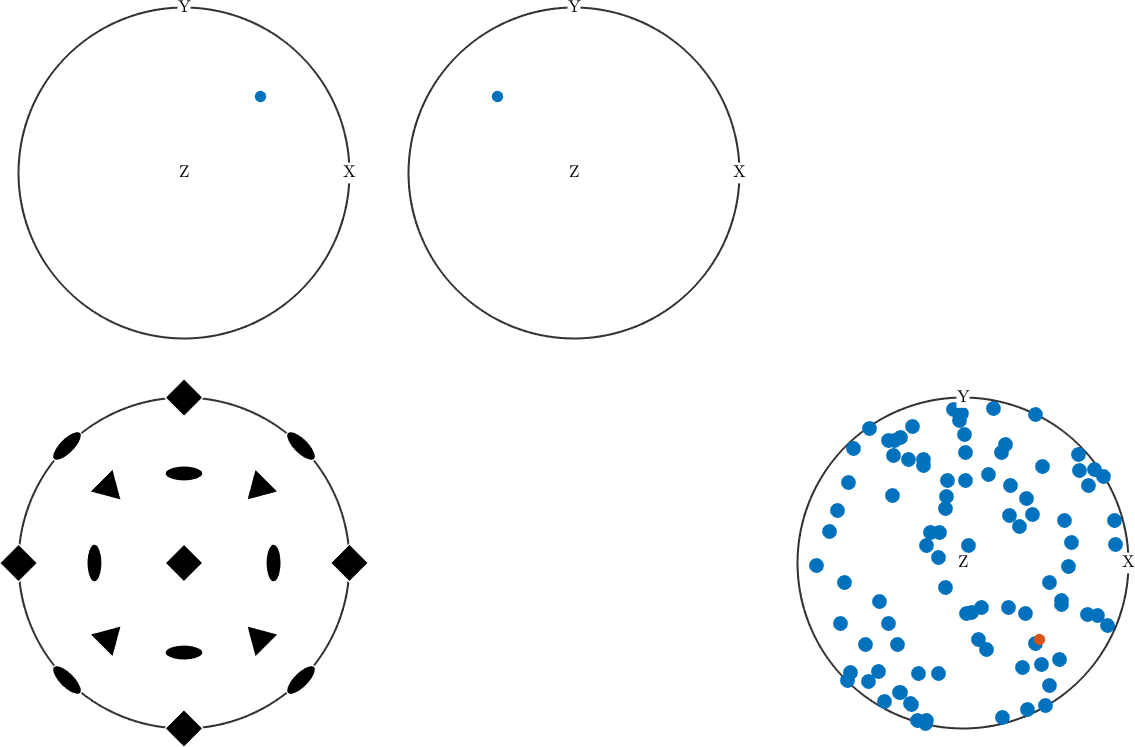
Across the staged figures, every occupied axis keeps the same size while the unused grid positions remain blank. The last addition also shows that a symmetry plot can use the same layout as spherical direction plots. See Spherical Projections for the hemisphere and projection choices used by the spherical axes.
Figure-wide controls
An mtexFigure makes shared controls possible, but it does not make independent data ranges equal automatically. When coloured panels show comparable quantities, set one range after drawing all panels and then add the colorbar:
setColorRange('equal')
mtexColorbar
Color Mapping explains when a common range is required. Annotations covers colorbars and other figure-wide additions. The figure manager also preserves consistent axis sizes after a resize. It provides the cropping used by saveFigure.
Use Combined Plots when the goal is to overlay data. For unrelated MATLAB axes, use subplot or a tiled chart layout instead of an mtexFigure.
Further reading
Wong, B. Layout. Nature Methods 8, 783 (2011). This short article explains how grids and visual order guide a reader through a multi-panel figure.
See the MathWorks tiled chart layout documentation. It describes MATLAB's general-purpose counterpart for arranging ordinary axes.
Citing this page.
This page is part of the documentation of
MTEX, a free and open
source MATLAB toolbox for analyzing and modeling crystallographic textures.
It was written by The MTEX Developers and is published at
https://mtex-toolbox.github.io/Multiplot.html.
If you use MTEX, or reuse text or figures from this page, in your research,
please cite
F. Bachmann, R. Hielscher, H. Schaeben: Texture Analysis with MTEX - Free and Open Source Software Toolbox, Solid State Phenomena 160 (2010), 63-68. 10.4028/www.scientific.net/SSP.160.63
BibTeX
@article{bachmann2010mtex,
  author  = {F. Bachmann and R. Hielscher and H. Schaeben},
  title   = {Texture Analysis with MTEX - Free and Open Source Software Toolbox},
  journal = {Solid State Phenomena},
  volume  = {160},
  pages   = {63-68},
  year    = {2010},
  doi     = {10.4028/www.scientific.net/SSP.160.63},
  url     = {https://doi.org/10.4028/www.scientific.net/SSP.160.63}
}
Other papers describing specific MTEX methods are listed under Publications — please cite the one that best fits your application. The MTEX source code is licensed under the GNU General Public License v2.0; the text and figures of this documentation are licensed under CC BY 4.0, which permits reuse — including by automated systems — provided The MTEX Developers and this page are credited.