
Crystal Shapes explains how MTEX builds a polyhedron from face normals. This page shows how to estimate the relative face distances from a published drawing with the Smorf crystal drawing tool, then transfer the result to MTEX.
The example reproduces the olivine growth form in Welsch et al. (2013).
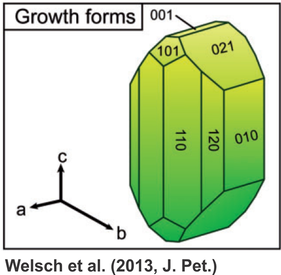
Notice the broad (010) and (110) faces, the narrow (001) cap and the bevels formed by the other three crystal forms. These relative face sizes are the target of the reconstruction.
A crystal habit is the characteristic external shape of a crystal and the development of its forms. The model reconstructed here is an idealized habit, not the measured three-dimensional morphology of an EBSD grain. Its fitted distances are geometric parameters, not growth rates or surface energies.
plottingConvention.default('y↑→x');Match the Symmetry and Unit Cell
Smorf is a free browser-based drawing tool maintained by Mark Holtkamp. Select the point group and enter the unit-cell lengths and angles from the source you want to reproduce. For an imported phase, these values are available from its crystal symmetry.
Choose Crystallographic (Kristall2000) for the face-distance interpretation. This is the convention that transfers to the MTEX construction below; the other choices scale the face normals differently.
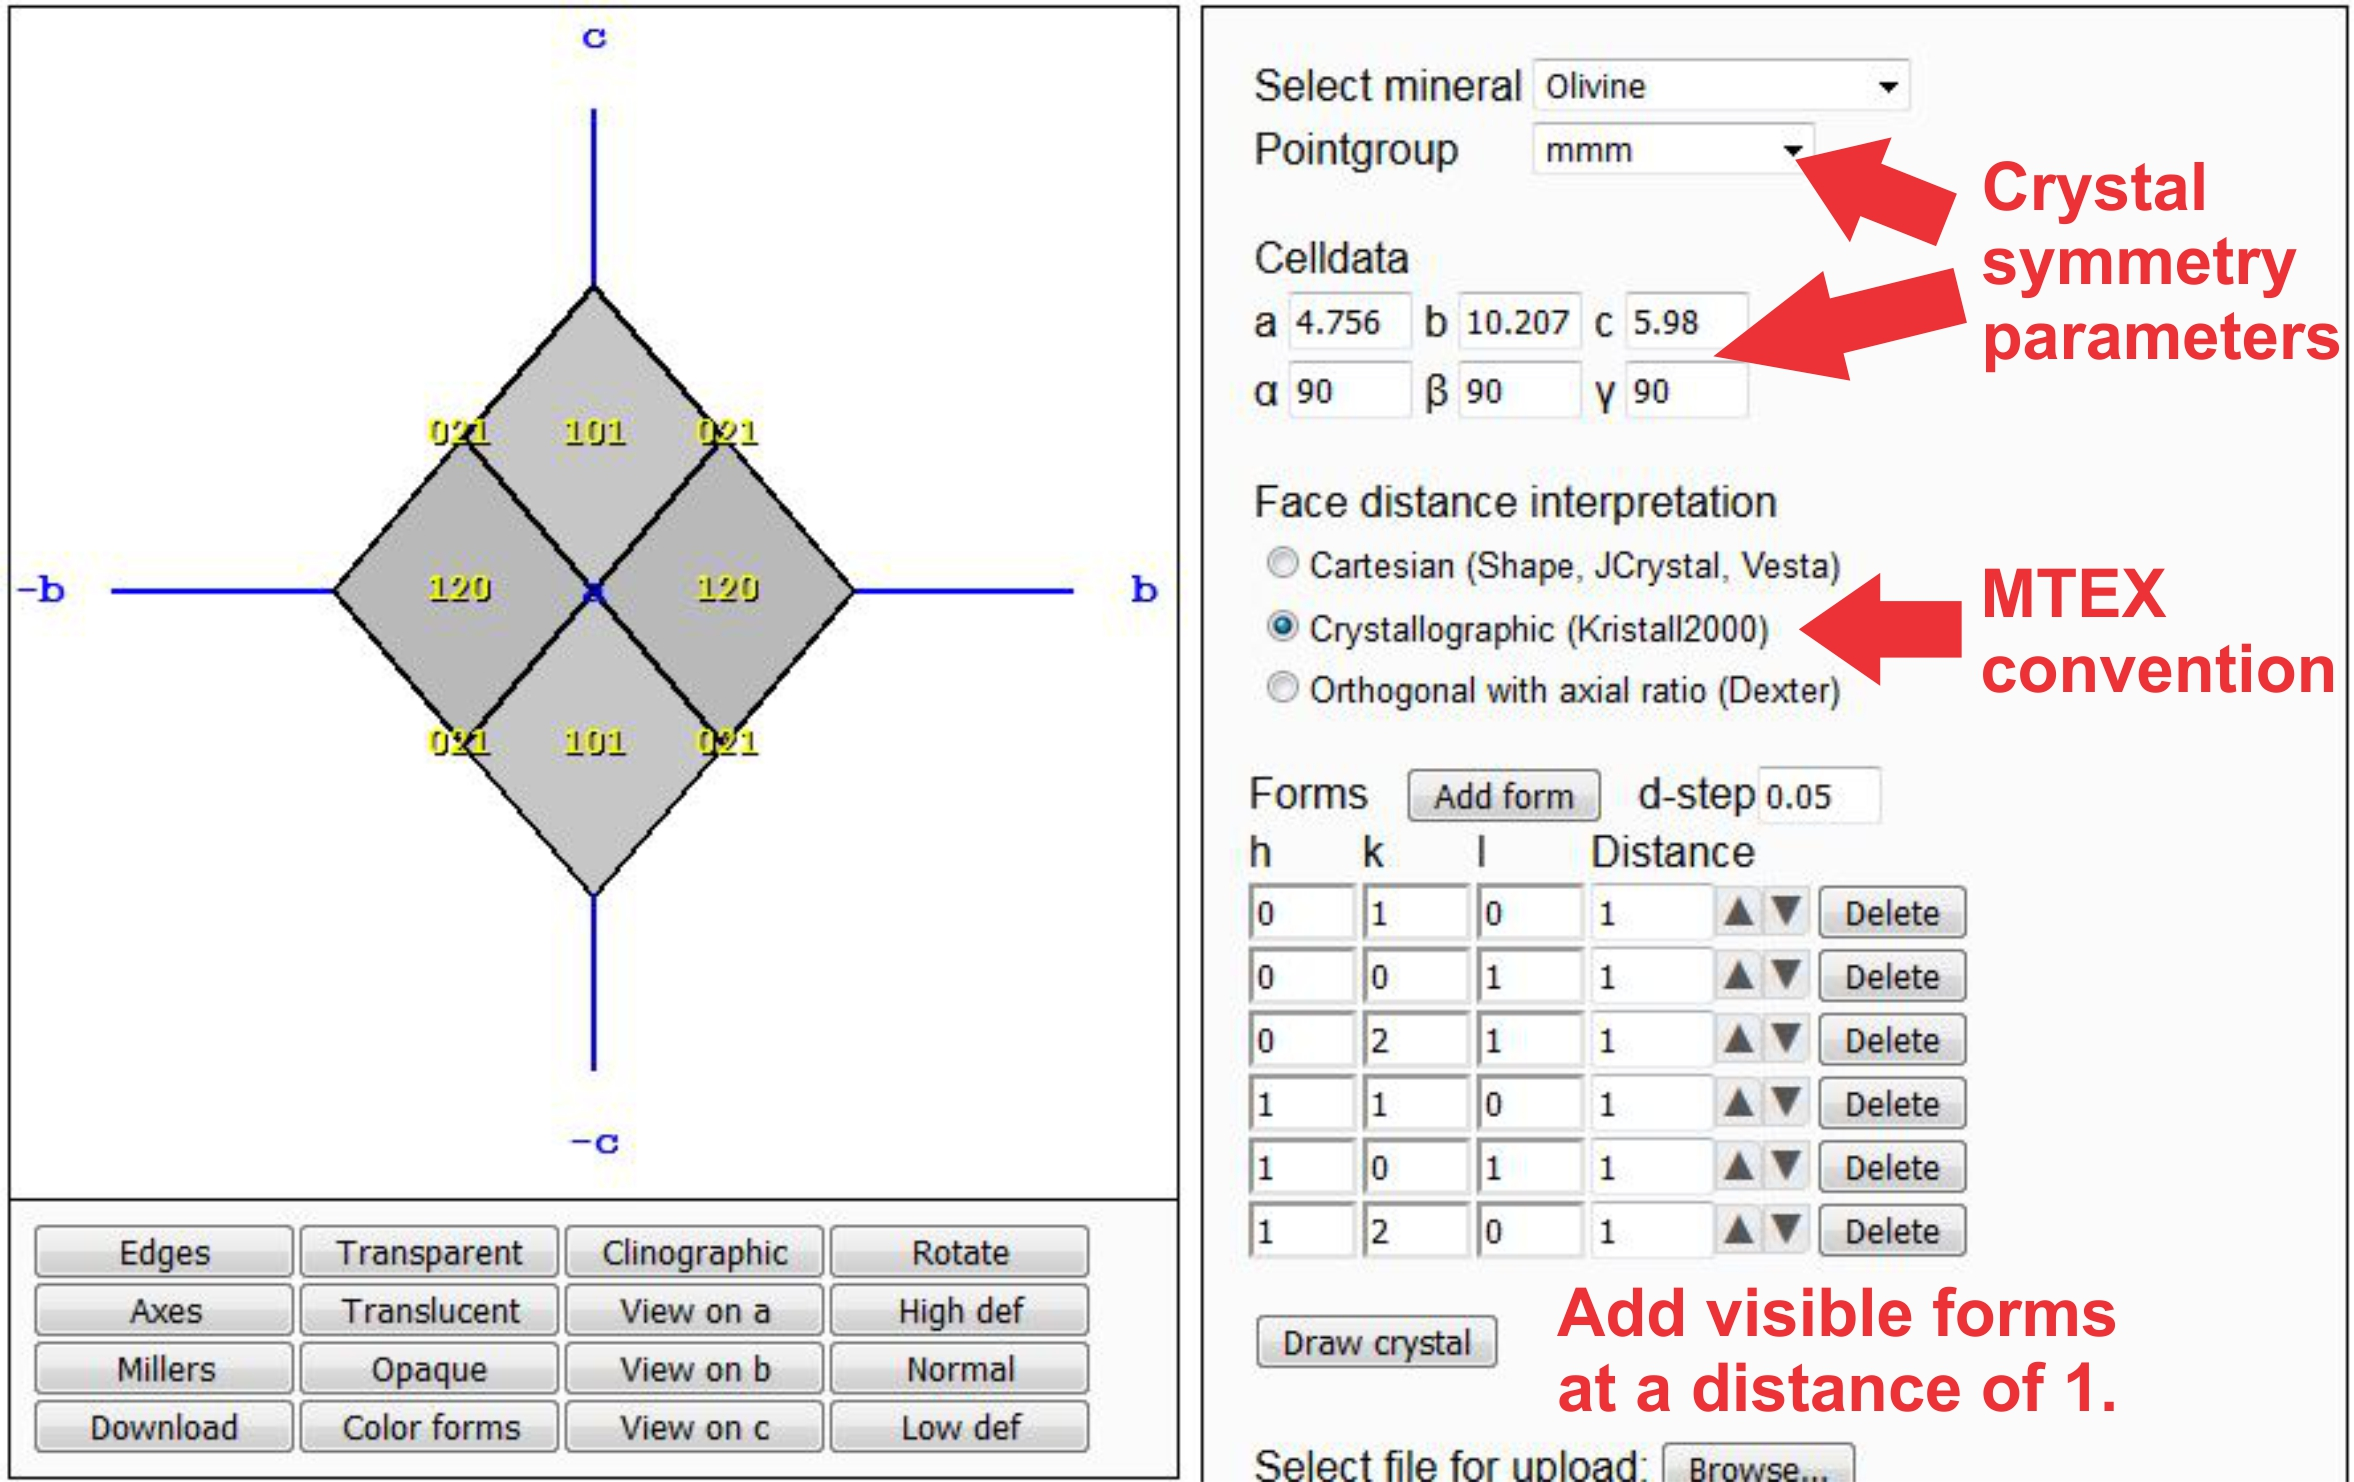
The screenshot pairs point group mmm with the three forsterite lattice parameters and highlights the required distance convention. The same crystal symmetry in MTEX is
cs = crystalSymmetry('mmm',[4.756 10.207 5.98], ...
  'mineral','Forsterite');
Enter the Crystal Forms
A crystal form is the set of faces generated from one face by the point group. Enter one representative Miller index for every form visible in views along \(\vec a\), \(\vec b\) and \(\vec c\). Start every form at distance 1 so that differences in the first drawing come only from the lattice metric and symmetry.
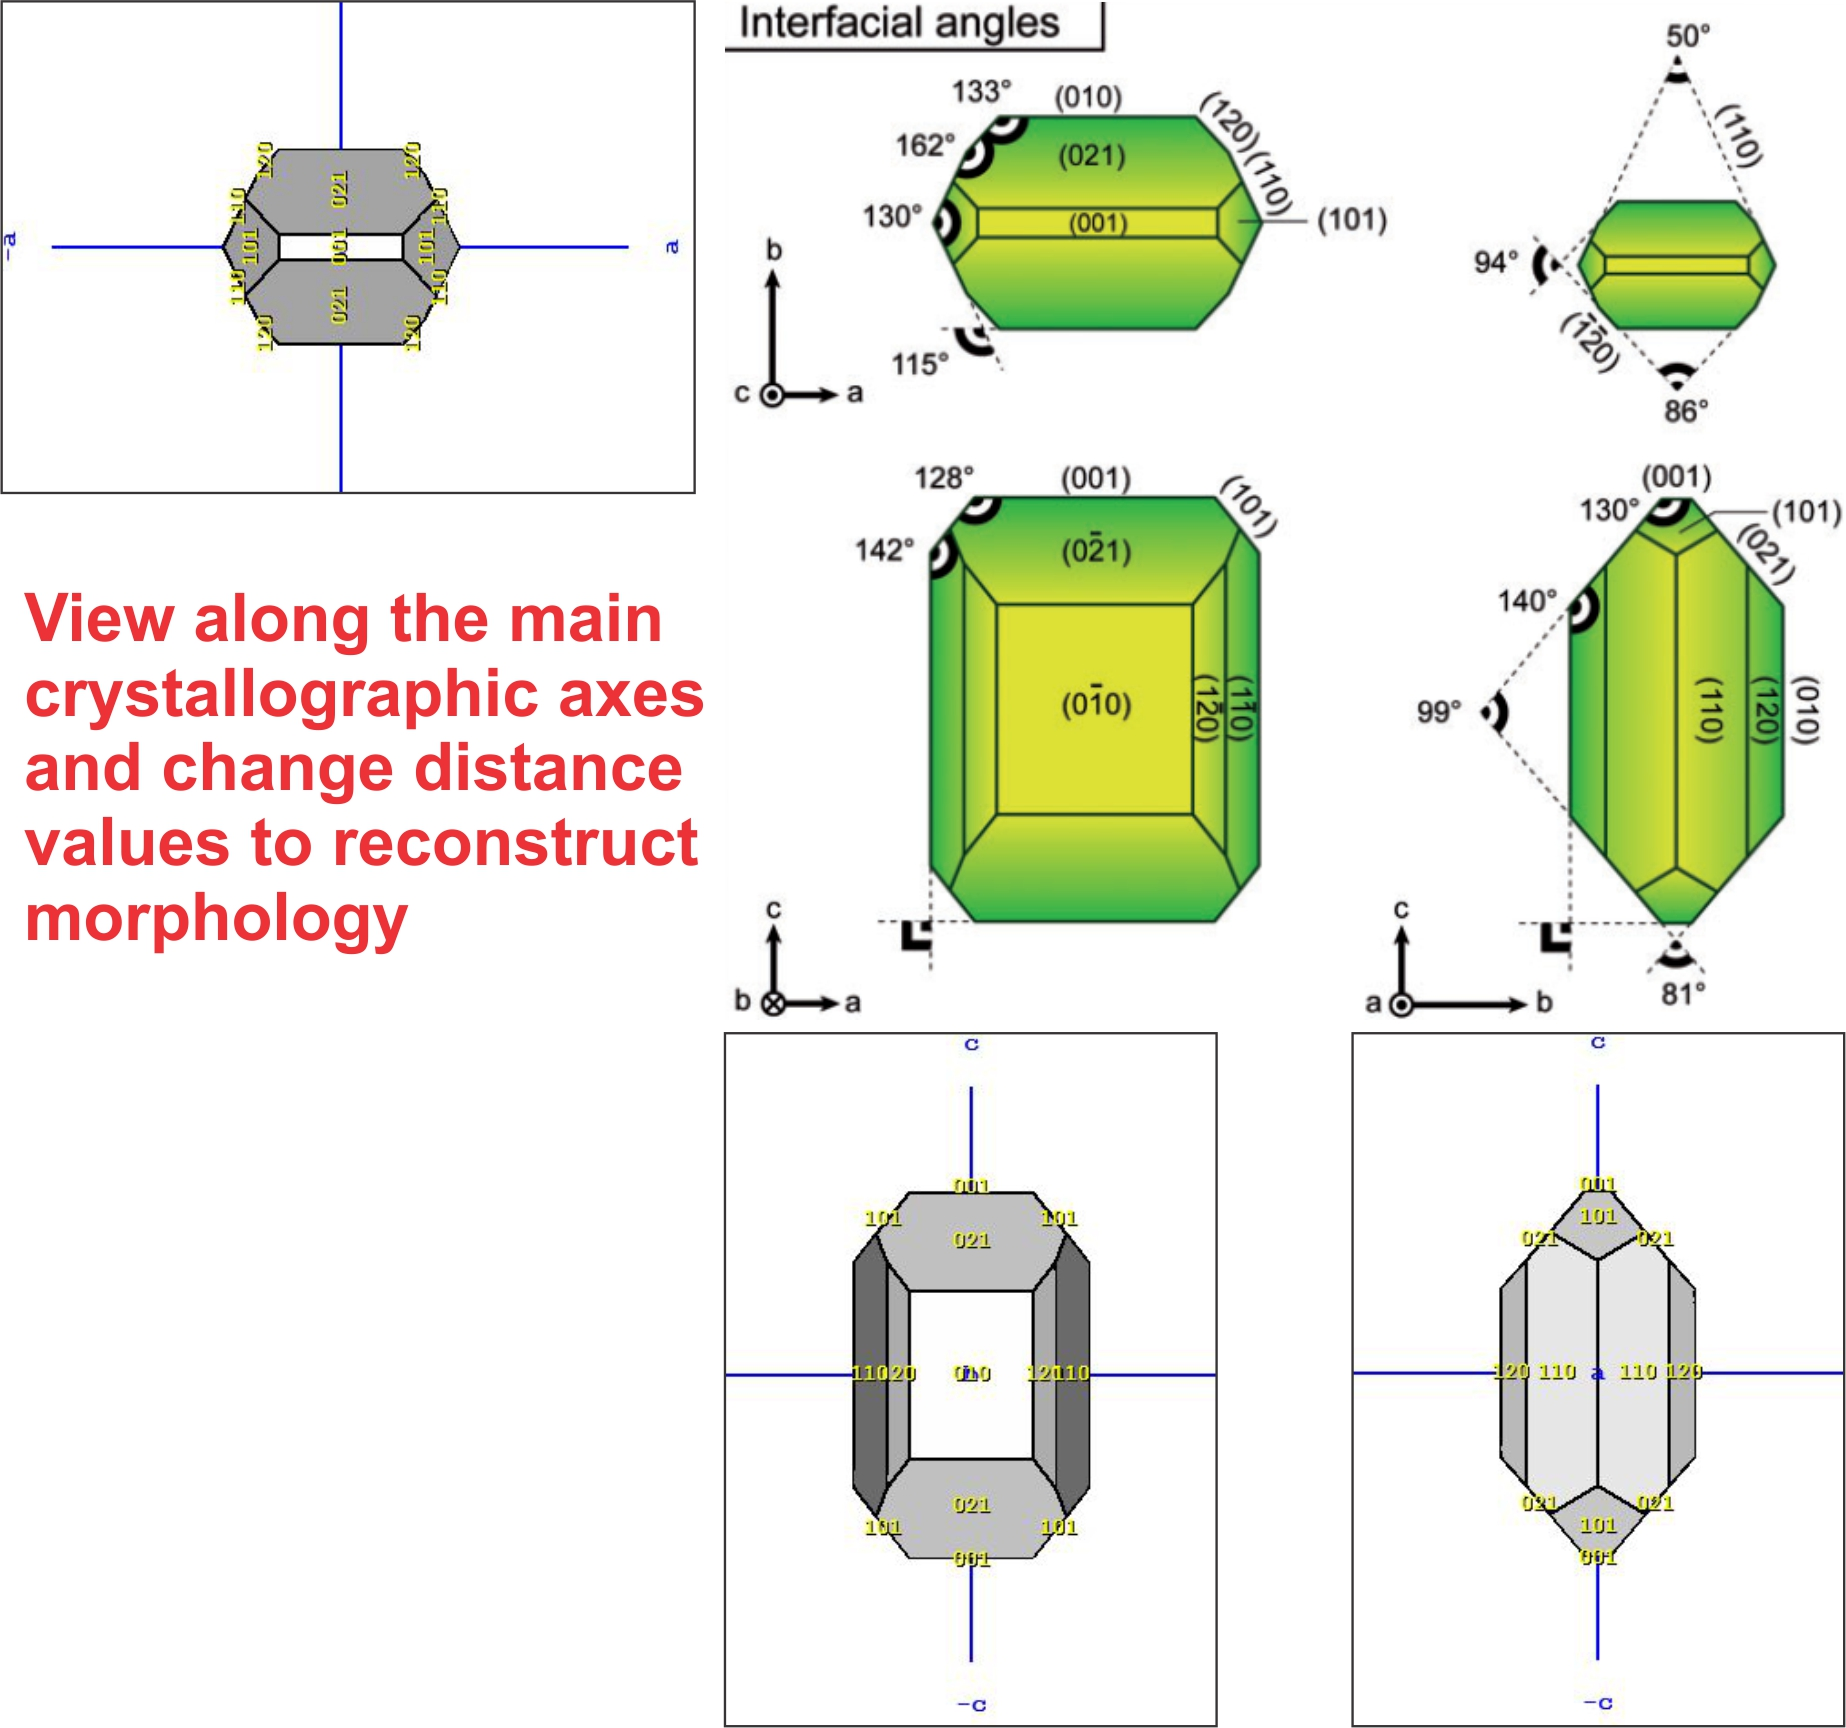
The slide sets the published views along \(\vec a\), \(\vec b\) and \(\vec c\) beside the Smorf drawing of the same views, with the interfacial angles to compare against. The equal-distance drawing in the previous screenshot is only a starting block: at distance 1 the (010), (001) and (110) forms do not reach the surface at all. The same six plane normals are a list of Miller indices in MTEX.
N = Miller({0,1,0},{0,0,1},{0,2,1}, ...
  {1,1,0},{1,0,1},{1,2,0},cs);
Tune the Face Distances
Change one distance at a time and redraw the crystal. A larger distance moves that form away from the origin, so the neighbouring forms cut its faces back and they shrink, until the form can disappear from the polyhedron altogether. Steps of 0.05 are small enough for this example.
Match the largest faces and the overall aspect ratio first. Then tune the smaller bevels. Smorf does not redraw automatically, so press Draw crystal after each change.
dist = [0.4, 1.3, 1.4, 1.05, 1.85, 1.35];
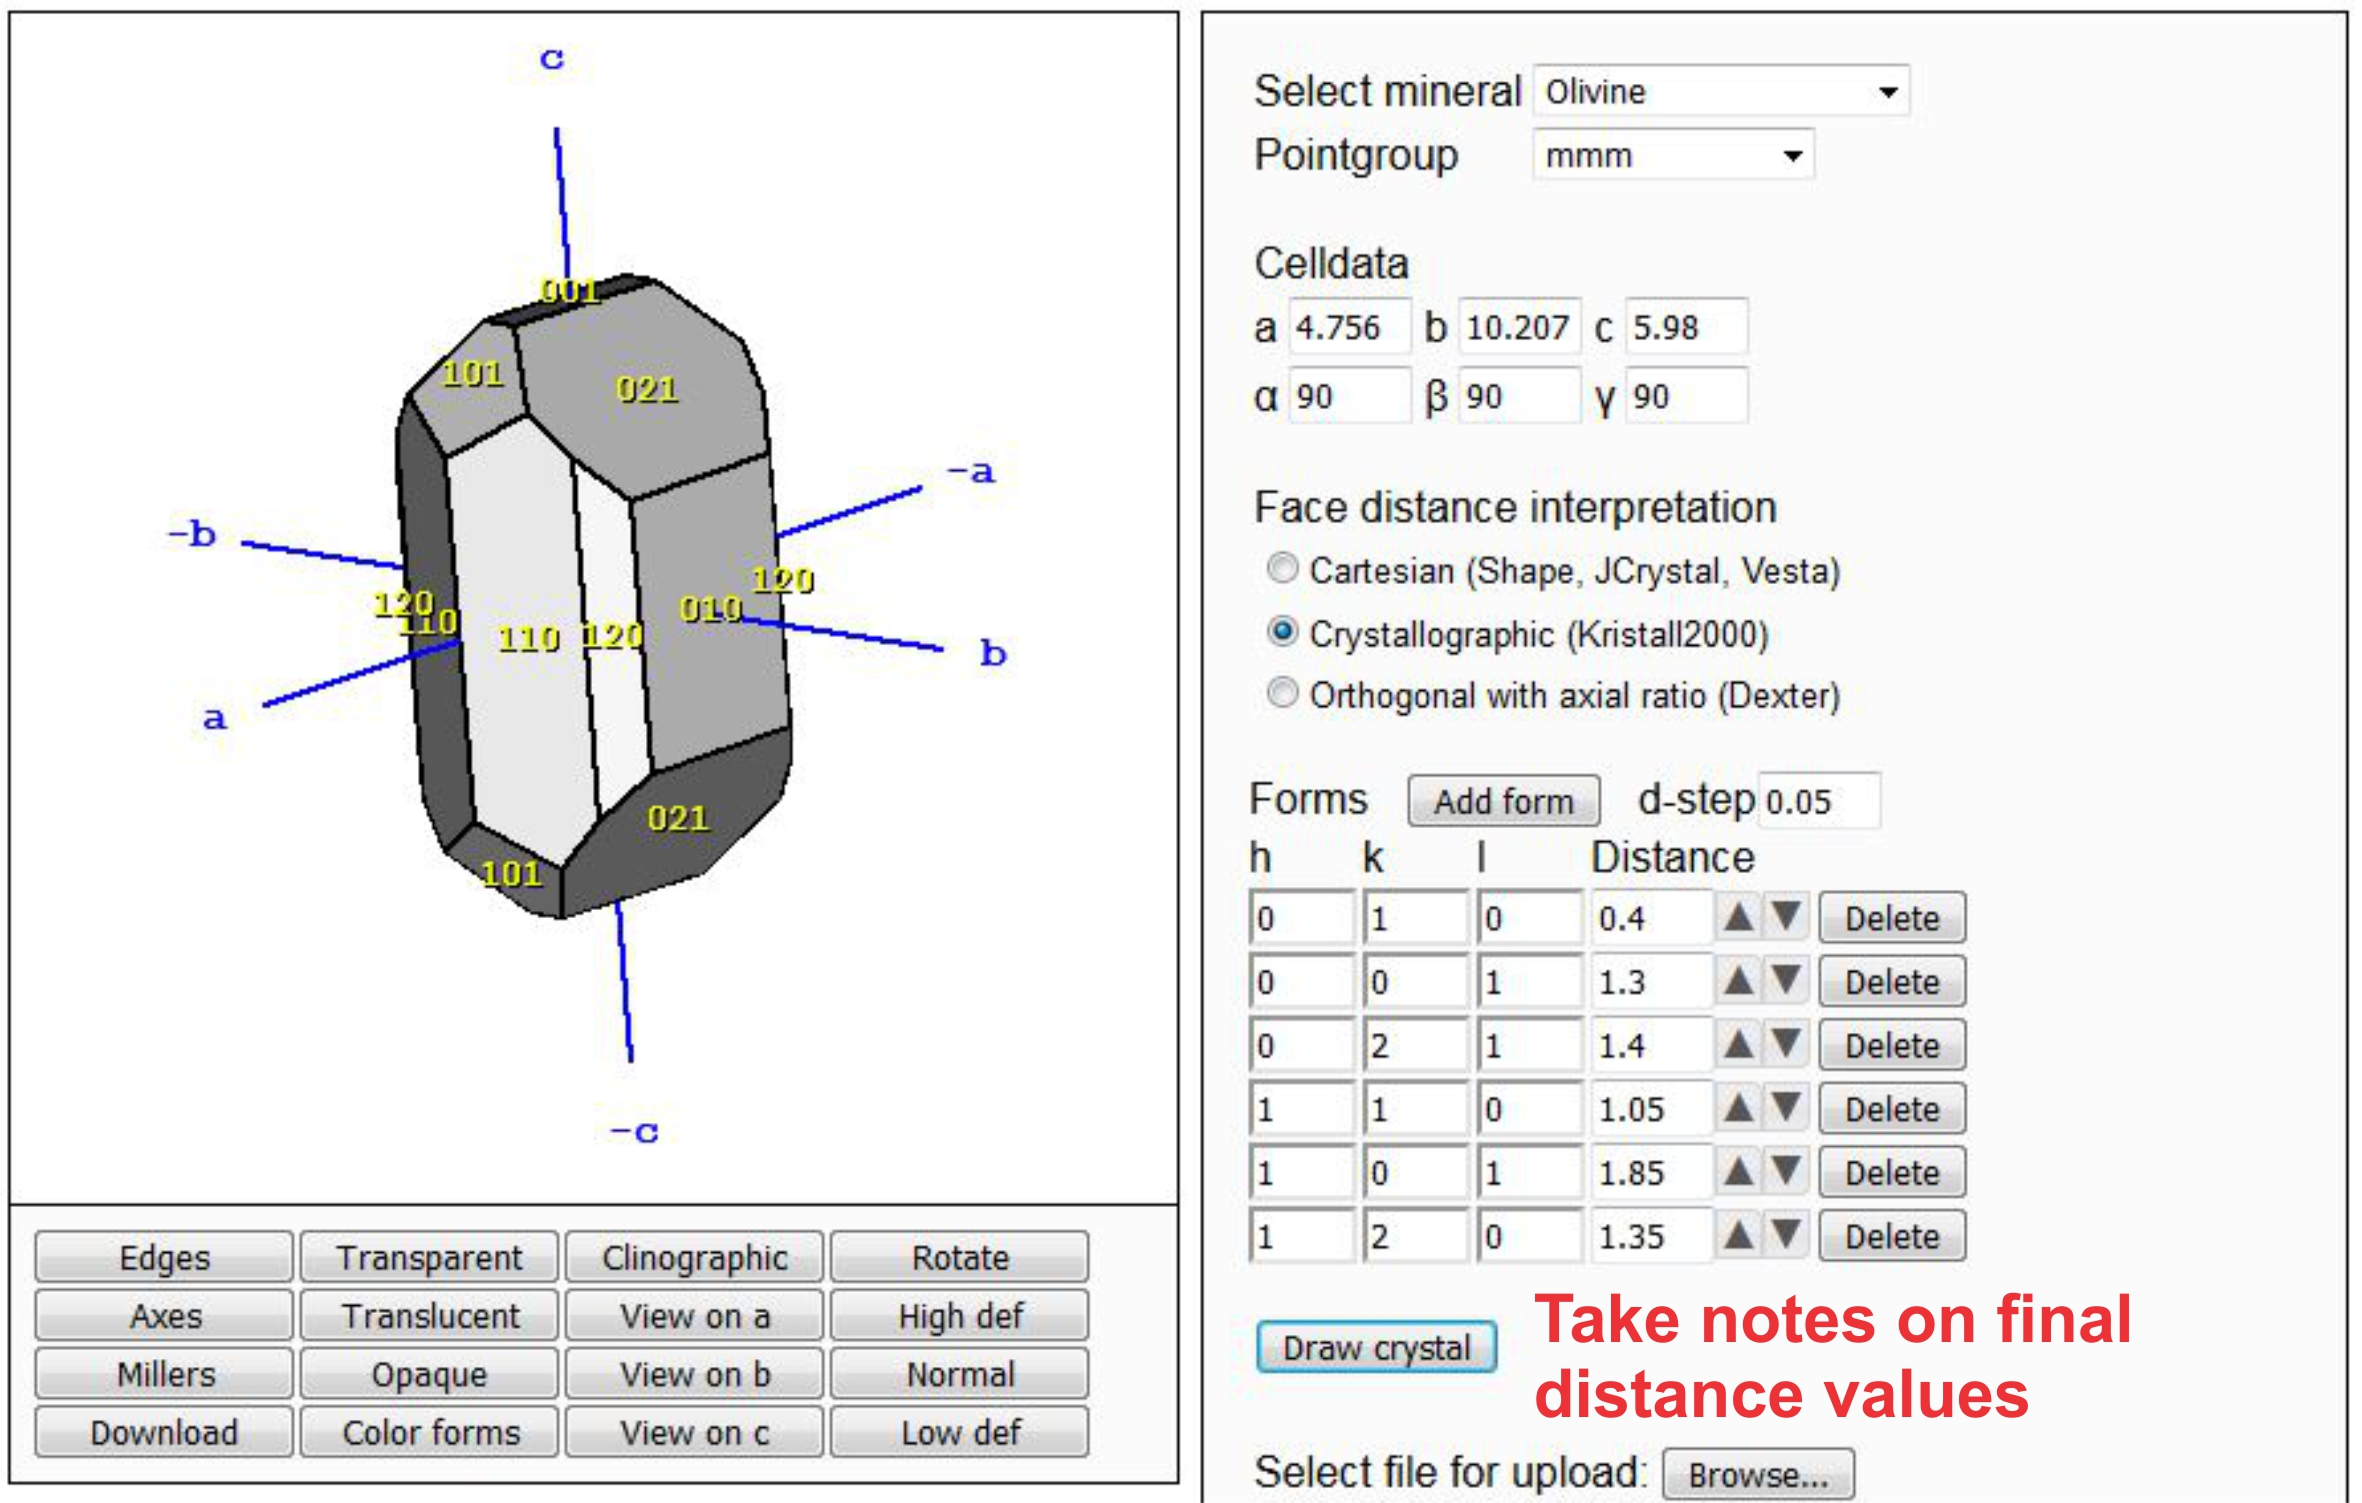
The tuned drawing now has the broad (010) and (110) sides, the small (001) cap and the bevels of the other three forms seen in the source figure. Only relative distances matter: multiplying every entry of dist by the same number leaves the normalized shape unchanged.
Transfer the Distances to MTEX
crystalShape describes each limiting plane by a normal \(\mathbf{n}\) and the half-space \(\mathbf{x}\cdot\mathbf{n}\leq 1\). A longer normal therefore moves its plane inward. To preserve the distances entered in Smorf, divide each Miller normal by its corresponding distance:
\[\mathbf{n}_{\mathrm{MTEX}} = \mathbf{n}_{hkl} / d_{\mathrm{Smorf}}.\]
cS = crystalShape(N ./ dist)cS = crystalShape
mineral: Forsterite (mmm)
vertices: 36
faces: 20plot(cS,'colored');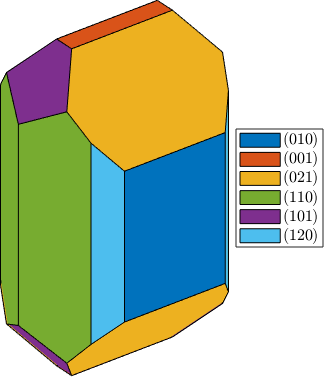
The MTEX figure reproduces the published habit. The (010) and (110) faces form the broad prism sides, the (021) faces terminate the ends around the small (001) caps, and the narrow (120) and (101) faces truncate the remaining edges and corners.
Check the Developed Faces
The constructor applies the point group to each input normal. The multiplicity is the number of symmetry-related faces in a form. The table separates the area of one face from the total area of its complete form.
multiplicity = N.multiplicity;
areaPerFace = zeros(size(multiplicity));
formArea = zeros(size(multiplicity));
for k = 1:length(N)
  areas = cS(N(k).symmetrise('unique')).faceArea;
  areaPerFace(k) = mean(areas);
  formArea(k) = sum(areas);
end
formName = ['(010)';'(001)';'(021)';'(110)';'(101)';'(120)'];
formSummary = table(formName,dist(:),multiplicity,areaPerFace,formArea, ...
  'VariableNames',{'Form','Distance','Multiplicity','AreaPerFace','FormArea'})
formSummary =
6×5 table
Form Distance Multiplicity AreaPerFace FormArea
_____ ________ ____________ ___________ ________
(010) 0.4 2 0.13897 0.27793
(001) 1.3 2 0.019766 0.039533
(021) 1.4 4 0.1384 0.55362
(110) 1.05 4 0.1346 0.53841
(101) 1.85 4 0.033199 0.13279
(120) 1.35 4 0.043238 0.17295The six input forms generate 20 faces. An individual (010) face is the largest at 0.13897, just above an individual (021) face at 0.13840. The four (021) and four (110) faces have the largest total form areas, 0.55362 and 0.53841. The two (001) caps are the smallest at 0.01977 each.
These areas belong to MTEX's normalized polyhedron and have no physical unit. Use them to compare relative face development within this shape.
Further Reading
- IUCr Online Dictionary of Crystallography: Habit defines habit and distinguishes face development.
- B. Welsch, F. Faure, V. Famin, A. Baronnet and P. Bachèlery, Dendritic Crystallization: A Single Process for all the Textures of Olivine in Basalts?, Journal of Petrology 54 (2013), 539--574, is the source of the target growth form.
- J. Enderlein, A Package for Displaying Crystal Morphology, The Mathematica Journal 7(1) (1997), 72--78, describes the geometric construction underlying
crystalShape.
Next
Return to Crystal Shapes to rotate, scale and place this idealized habit as an orientation glyph. See Miller Indices for the distinction between plane normals and crystal directions, and Crystal Symmetries for point groups and unit-cell definitions.
Citing this page.
This page is part of the documentation of
MTEX, a free and open
source MATLAB toolbox for analyzing and modeling crystallographic textures.
It was written by The MTEX Developers and is published at
https://mtex-toolbox.github.io/CrystalShapeSmorf.html.
If you use MTEX, or reuse text or figures from this page, in your research,
please cite
F. Bachmann, R. Hielscher, H. Schaeben: Texture Analysis with MTEX - Free and Open Source Software Toolbox, Solid State Phenomena 160 (2010), 63-68. 10.4028/www.scientific.net/SSP.160.63
BibTeX
@article{bachmann2010mtex,
  author  = {F. Bachmann and R. Hielscher and H. Schaeben},
  title   = {Texture Analysis with MTEX - Free and Open Source Software Toolbox},
  journal = {Solid State Phenomena},
  volume  = {160},
  pages   = {63-68},
  year    = {2010},
  doi     = {10.4028/www.scientific.net/SSP.160.63},
  url     = {https://doi.org/10.4028/www.scientific.net/SSP.160.63}
}
Other papers describing specific MTEX methods are listed under Publications — please cite the one that best fits your application. The MTEX source code is licensed under the GNU General Public License v2.0; the text and figures of this documentation are licensed under CC BY 4.0, which permits reuse — including by automated systems — provided The MTEX Developers and this page are credited.