
A spherical function assigns a value to every direction on the unit sphere. The input is a direction and the output may be a density, a speed, or another physical quantity.
Pole density, inverse pole density, the directional magnitude of a tensor, and wave velocity are examples from texture analysis. MTEX gives them the common interface S2Fun.
A function, not a sampled grid
The Santa Fe orientation distribution function (ODF) is a standard model texture. Fixing the crystal direction \((100)\) gives a pole density function. It measures how strongly that crystal direction points along each specimen direction.
% the famous Santa Fe orientation distribution function
odf = SantaFe;

% the (100) pole density function
pdf = odf.calcPDF(Miller(1,0,0,odf.CS));
The resulting object represents the function itself, not a grid of stored values. It can be evaluated at any direction, including one that was not used to construct or display it.
% choose a direction by polar angle and azimuth
r = vector3d.byPolar(35*degree,20*degree);

% evaluate the pole density at that direction
valueAtR = pdf.eval(r);
fprintf('Pole density at r: %.3f mrd\n',valueAtR)
Pole density at r: 1.004 mrdThe value is 1.004 multiples of a random distribution (mrd). Evaluation returns a number; the direction r remains available for plotting or for another calculation.
Draw the function
Plotting evaluates the function on the grid needed by the selected spherical projection. The projection is chosen at plotting time and is not a property of the function.
plot(pdf)
mtexColorbar('title','mrd')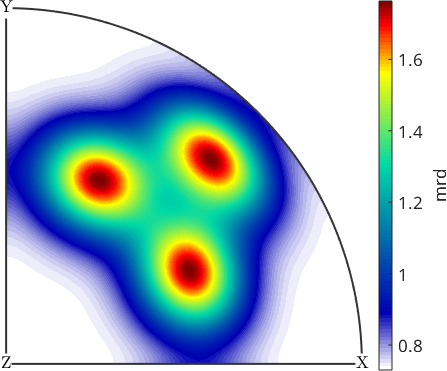
The bright lobes are directions with high \((100)\) pole density. The colour bar uses mrd, where 1 mrd is the random reference value. The colours sample pdf for this plot, but they do not become its stored representation.
Find features on the function
An extremum search also acts on the function rather than on a display grid. Its result is therefore not limited by the plot resolution.
[~,localMax] = max(pdf,'numLocal',12);
peakCount = length(localMax)

annotate(localMax)
peakCount =
6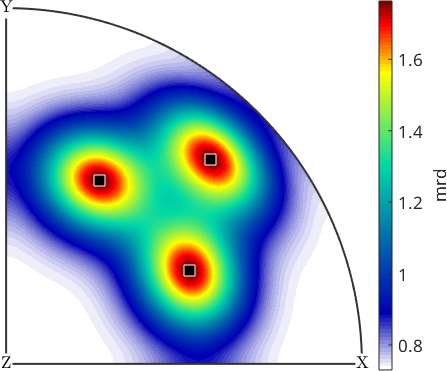
Six maxima are returned although twelve were requested. The 'numLocal' option is an upper limit. This pole density has six distinct local maxima after each pair of antipodal directions has been identified, as it is in a pole figure. The markers locate those maxima on the plot.
Reference frame and symmetry
A reference frame is the coordinate system in which the directions are expressed. It includes the frame identity, its basis, and its default plotting convention. It is distinct from symmetry, which states the transformations under which data is invariant.
An ordinary S2Fun may carry a reference frame but does not carry a symmetry. The class S2FunHarmonicSym stores a symmetrised harmonic function together with its symmetry. The symmetry supplies that function's reference frame.
Representations
The common interface hides several representations that store a spherical function in different ways:
|
representation |
MTEX class |
|
harmonic expansion |
|
|
finite elements |
|
|
function handle |
|
|
Bingham distribution |
The representation affects speed and which calculations can be exact. A harmonic expansion supports cheap integration and convolution. A function handle evaluates its defining function exactly, but does little else quickly.
The syntax remains the same across representations. Operations written for S2Fun work with every representation, and arithmetic between two functions works as it does between numbers.
Generalisations
The same interface extends to functions with non-scalar values and to functions with symmetry built in:
|
kind of function |
MTEX class |
|
spherical vector field |
|
|
spherical axis field |
|
|
radial spherical function |
|
|
symmetric spherical function |
An axis field is not a vector field with a sign convention. Its values are axes, so a value and its negative represent the same axis. This is the appropriate model for a direction without a sense.
close allReferences
- K. Pawlik, J. Pospiech and K. Luecke, The development of a new direct method of ODF reproduction from pole figures and its testing with the help of model functions, in J. S. Kallend and G. Gottstein (eds.), ICOTOM 8, The Metallurgical Society, 105--110, 1988. This work gives the Santa Fe model function used in the example.
Next
Continue with Operations to evaluate, combine, differentiate, integrate and search spherical functions.
Citing this page.
This page is part of the documentation of
MTEX, a free and open
source MATLAB toolbox for analyzing and modeling crystallographic textures.
It was written by The MTEX Developers and is published at
https://mtex-toolbox.github.io/S2FunConcept.html.
If you use MTEX, or reuse text or figures from this page, in your research,
please cite
F. Bachmann, R. Hielscher, H. Schaeben: Texture Analysis with MTEX - Free and Open Source Software Toolbox, Solid State Phenomena 160 (2010), 63-68. 10.4028/www.scientific.net/SSP.160.63
BibTeX
@article{bachmann2010mtex,
  author  = {F. Bachmann and R. Hielscher and H. Schaeben},
  title   = {Texture Analysis with MTEX - Free and Open Source Software Toolbox},
  journal = {Solid State Phenomena},
  volume  = {160},
  pages   = {63-68},
  year    = {2010},
  doi     = {10.4028/www.scientific.net/SSP.160.63},
  url     = {https://doi.org/10.4028/www.scientific.net/SSP.160.63}
}
Other papers describing specific MTEX methods are listed under Publications — please cite the one that best fits your application. The MTEX source code is licensed under the GNU General Public License v2.0; the text and figures of this documentation are licensed under CC BY 4.0, which permits reuse — including by automated systems — provided The MTEX Developers and this page are credited.