This page turns an EBSD map into the stiffness tensor and seismic-wave plots of a polycrystalline aggregate. The required inputs are the phase proportions, the crystal orientations, one single-crystal stiffness tensor per phase, and the corresponding densities. The result connects a crystallographic preferred orientation (CPO) to directional wave speeds.
The worked sequence has four steps: place the map in its external reference frame, define the phase tensors, average them over the measured orientations, and inspect the aggregate seismic plots.
plottingConvention.default('y↑→x');
mtexdata forsterite
ebsd = EBSDsquare (y↑→x, row↑→col)
Phase Orientations Mineral Color Symmetry Crystal reference frame
0 58485 (24%) notIndexed none
1 152345 (62%) Forsterite LightSkyBlue mmm
2 26058 (11%) Enstatite DarkSeaGreen mmm
3 9064 (3.7%) Diopside Goldenrod 12/m1 X||a*, Y||b, Z||c
Properties: bands, bc, bs, error, mad, oldId
Scan unit : um
X × Y × Z : [0 → 36550] × [0 → 16750] × [0 → 0]
Normal vector: (0,0,1)
Square grid :336 × 732Inspect the phases and choose the averaging population
The map contains Forsterite, Enstatite, and Diopside. Its display reports approximately 62% Forsterite, 11% Enstatite, 3.7% Diopside, and 24% notIndexed pixels. For an elastic aggregate, the phase proportions must be normalized over the indexed pixels because no orientation or phase tensor is available for the notIndexed measurements.
phaseFraction = [length(ebsd('f')),length(ebsd('e')),length(ebsd('d'))] ...
  ./ length(ebsd('indexed'));

fprintf(['Indexed phase fractions: Forsterite %.1f%%, Enstatite %.1f%%, ' ...
  'Diopside %.1f%%.\n'],100*phaseFraction)
Indexed phase fractions: Forsterite 81.3%, Enstatite 13.9%, Diopside 4.8%.Place the map in the external reference frame
In the imported map, the foliation runs north--south. Standard geoscience CPO plots and physical-property plots instead use an external reference frame with vertical east--west foliation and horizontal east--west lineation. Rotating the complete dataset by 90 degrees about the \(z\)-axis moves both its positions and its orientations into that frame.
ebsd = rotation.byAxisAngle(zvector,-90*degree) * ebsd;The next command puts \(x\) towards north for a better screen fit. It changes the session-wide plotting convention, so the map, pole figures, and tensor plots below all use the same screen directions.
plotx2north
plot(ebsd,'refFrame','on')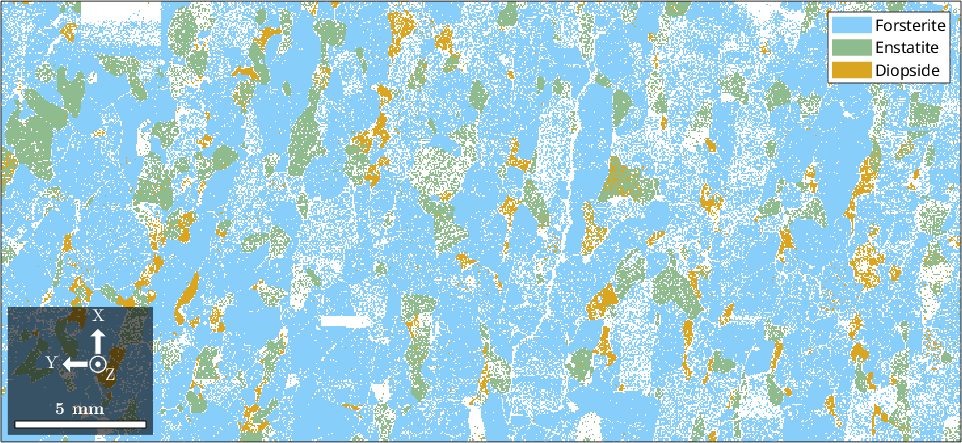
The reference-frame arrows are the check on this operation. Read them before interpreting a fast direction as a geological lineation.
Define the Forsterite stiffness tensor
Abramson et al. (1997) reported the following olivine stiffness coefficients in GPa. The crystal symmetry records the lattice parameters and the crystal reference frame in which those coefficients were measured. The density is in \(\mathrm{g/cm}^3\) so that velocity returns km/s.
CS_Tensor_Fo = crystalSymmetry('222',[4.762 10.225 5.994],...
  'mineral','Forsterite','color','light red');

rho_Fo = 3.3550;

Cij = [[320.5  68.15  71.6     0     0     0];...
  [ 68.15  196.5  76.8     0     0     0];...
  [ 71.6    76.8 233.5     0     0     0];...
  [  0       0      0     64     0     0];...
  [  0       0      0      0    77     0];...
  [  0       0      0      0     0    78.7]];

C_Fo = stiffnessTensor(Cij,CS_Tensor_Fo,'density',rho_Fo);
A single-crystal tensor must always carry the crystal reference frame used to express its components \(c_{ijkl}\). Equal-looking component tables in different frames do not describe the same directions in the crystal.
Define the Enstatite stiffness tensor
The phase named Enstatite uses the orthopyroxene coefficients reported by Chai et al. (1997). The explicit alignment states that \(x\) is parallel to the \(a\)-axis and \(z\) is parallel to the \(c\)-axis.
cs_Tensor_opx = crystalSymmetry('mmm',[18.2457 8.7984 5.1959],...
  [90 90 90]*degree,'x||a','z||c','mineral','Enstatite');

rho_opx = 3.3060;

Cij = [[236.90 79.60 63.20  0.00  0.00  0.00];...
  [79.60 180.50 56.80  0.00  0.00  0.00];...
  [63.20  56.80 230.40  0.00  0.00  0.00];...
  [ 0.00   0.00  0.00 84.30  0.00  0.00];...
  [ 0.00   0.00  0.00  0.00 79.40  0.00];...
  [ 0.00   0.00  0.00  0.00  0.00 80.10]];

C_opx = stiffnessTensor(Cij,cs_Tensor_opx,'density',rho_opx);
Define the Diopside stiffness tensor
Isaak et al. published these monoclinic chrome-diopside coefficients online in 2005. Their table uses \(x\) parallel to the \(a^{*}\)-axis and \(z\) parallel to the \(c\)-axis.
cs_Tensor_cpx = crystalSymmetry('121',[9.585 8.776 5.26],...
  [90 105.86 90]*degree,'x||a*','z||c','mineral','Diopside');

rho_cpx = 3.2860;

Cij = [[228.10 78.80 70.20  0.00  7.90  0.00];...
  [78.80 181.10 61.10  0.00  5.90  0.00];...
  [70.20  61.10 245.40  0.00 39.70  0.00];...
  [ 0.00   0.00  0.00 78.90  0.00  6.40];...
  [ 7.90   5.90 39.70  0.00 68.20  0.00];...
  [ 0.00   0.00  0.00  6.40  0.00 78.10]];

C_cpx = stiffnessTensor(Cij,cs_Tensor_cpx,'density',rho_cpx);
Match the tensor and EBSD crystal frames
The published Diopside lattice parameters differ from those of the measured phase by about 2%. calcTensor matches a phase tensor by mineral name, Laue group, and lattice parameters. It accepts at most 1% relative deviation in the lattice axes and 0.01 rad in the lattice angles, so it deliberately rejects this near match.
The remedy is transformReferenceFrame. A frame change re-expresses the same physical tensor in the crystal frame of the measured phase; it does not rotate the crystal or change its elastic response.
C_cpx = transformReferenceFrame(C_cpx,ebsd('Diopside').CS);Only Diopside needs this explicit frame change. The Forsterite and Enstatite tensor frames already match their measured phases within the tolerances.
Read a single-crystal seismic overview
Wave Velocities develops the three wave modes and their polarization directions. Here plotSeismicVelocities summarizes the Forsterite result.
plotSeismicVelocities(C_Fo)

% Add crystal-axis labels to the S-wave anisotropy panel.
nextAxis(1,2)
hold on
text(Miller({1,0,0},{0,1,0},{0,0,1},CS_Tensor_Fo),...
  {'[100]','[010]','[001]'},'backgroundColor','w')
hold off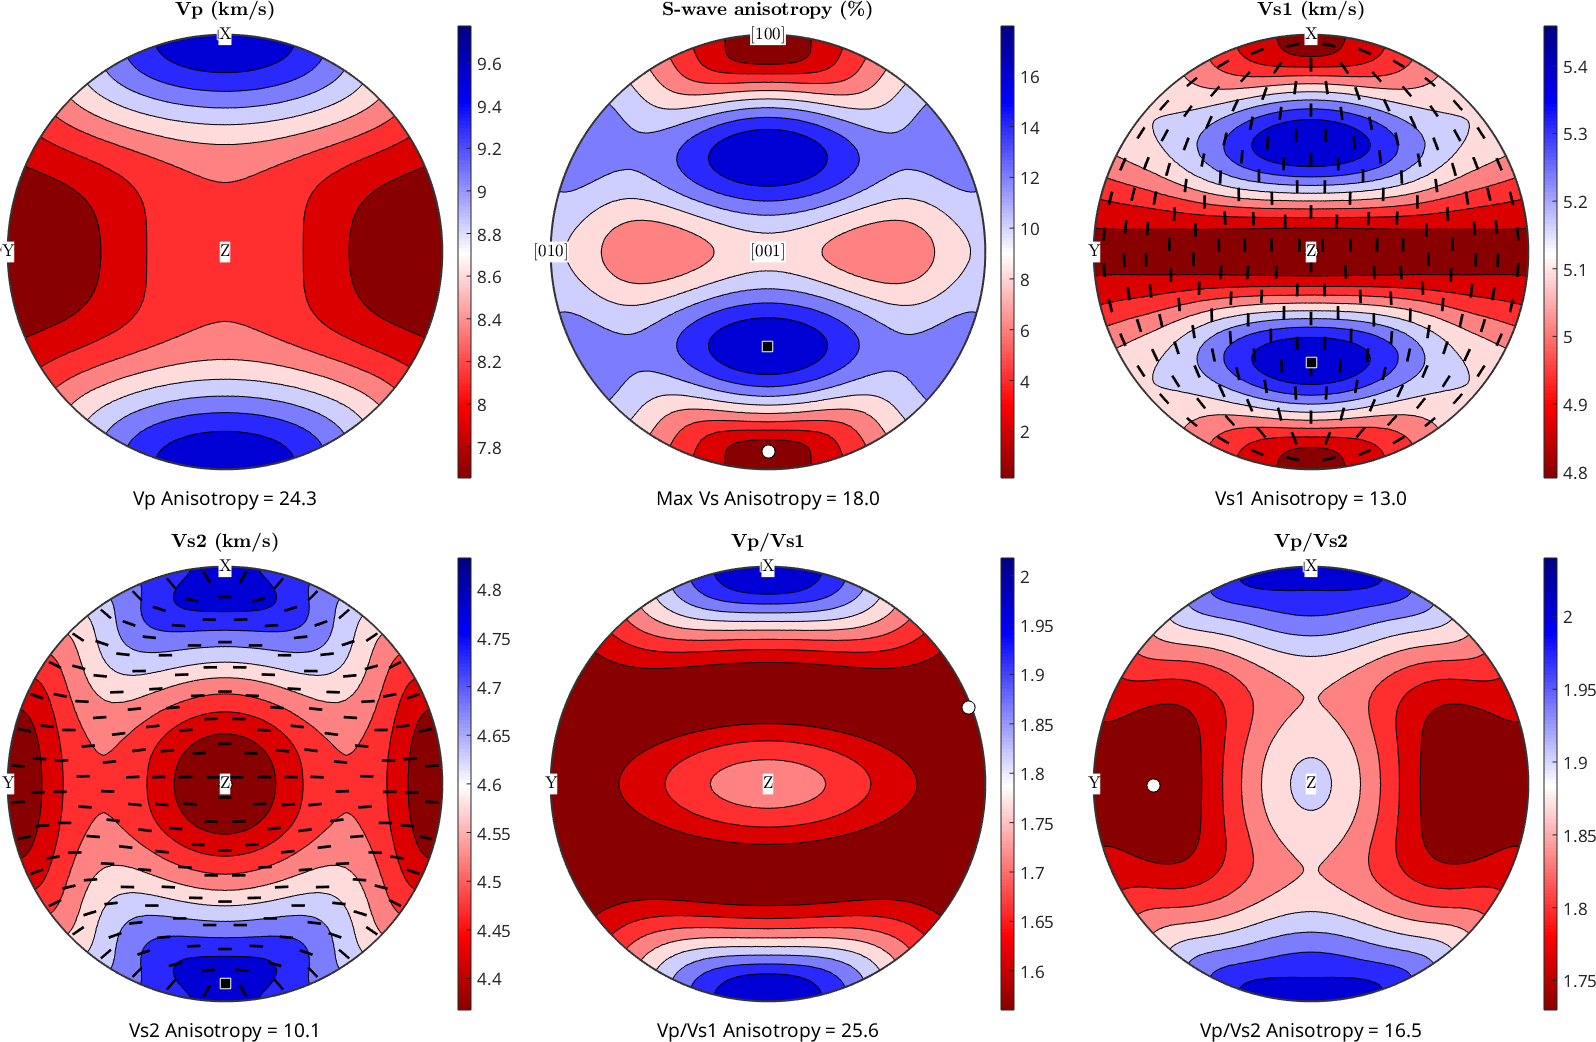
Red is slow and blue is fast. In each velocity panel, a black square marks the maximum and a white circle marks the minimum. The short bars in the \(V_{s1}\) and \(V_{s2}\) panels show shear-wave polarization. The added crystal axes let you relate these patterns to directions in the Forsterite lattice.
Average the measured orientations directly
Tensor Averages explains the Voigt uniform-strain estimate, the Reuss uniform-stress estimate, and their Hill mean. calcTensor rotates the appropriate phase tensor by every indexed orientation and returns all three aggregate estimates.
[CVoigtEbsd,CReussEbsd,CHillEbsd] = ...
  calcTensor(ebsd,C_Fo,C_opx,C_cpx);

plotSeismicVelocities(CHillEbsd)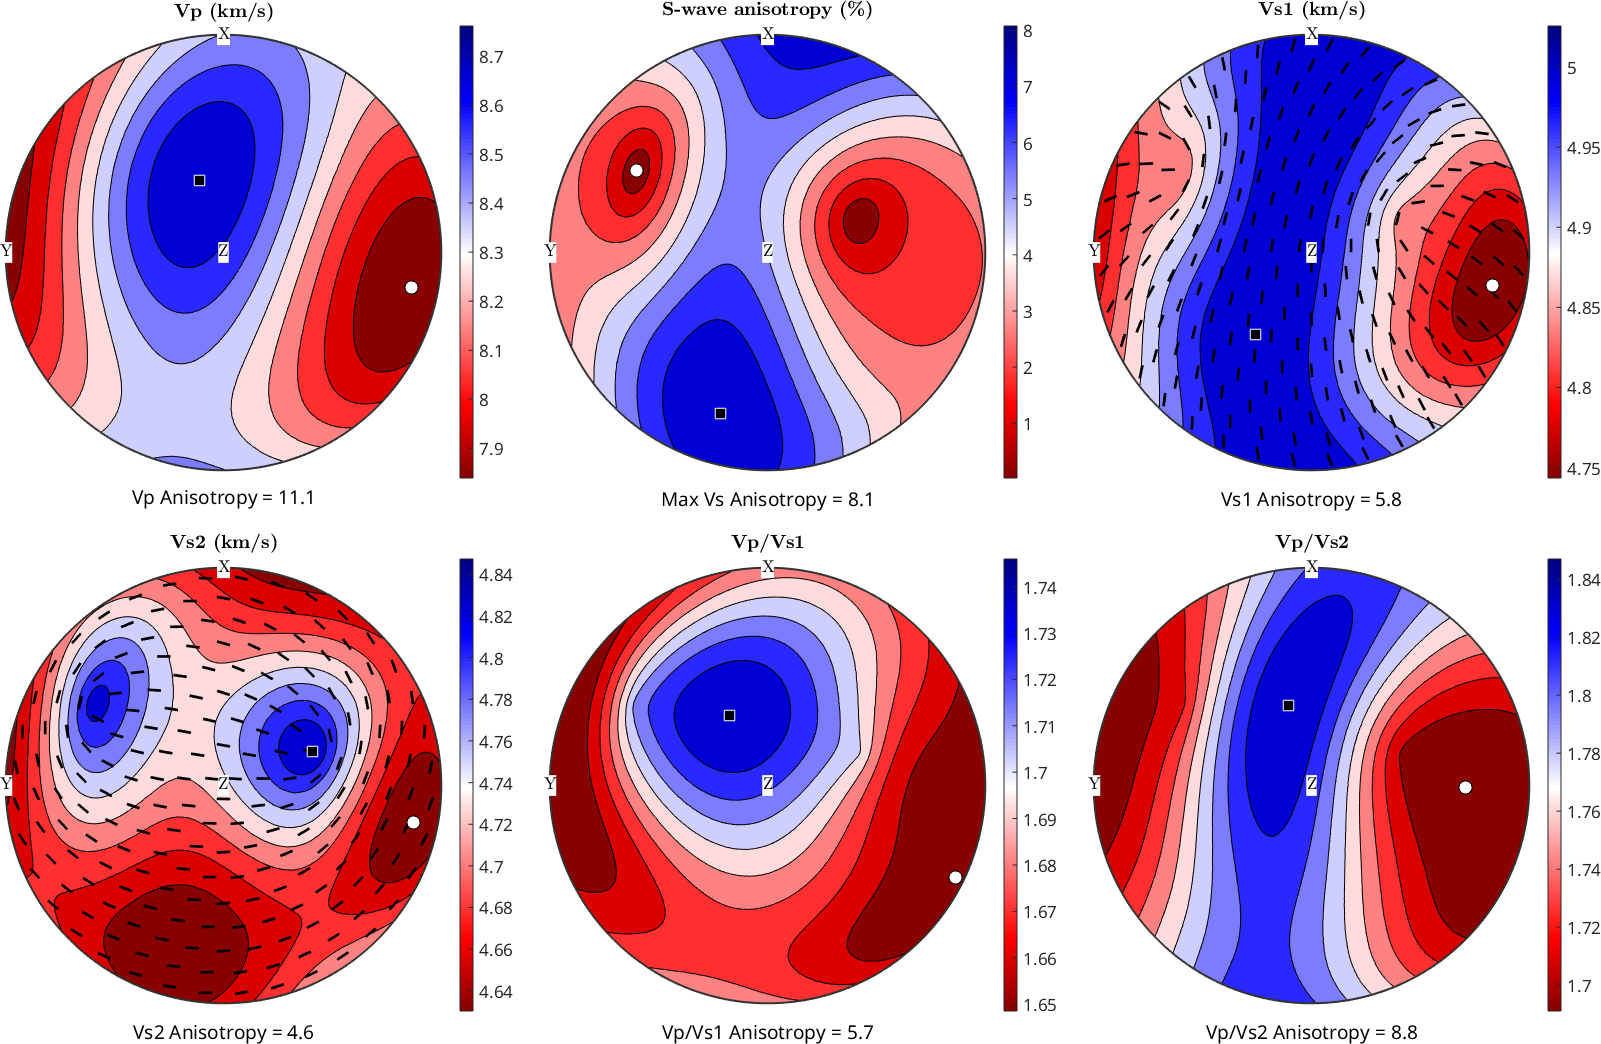
This plot is read in the external frame checked above, not in any one crystal frame. Compare it with the single-crystal plot: averaging weakens the directional contrast, but the CPO leaves preferred fast and slow directions. The subtitle of each panel reports its anisotropy.
Average orientation distributions phase by phase
Direct averaging can be slow for a large EBSD dataset. An alternative is to estimate one orientation distribution function (ODF) per phase, then average each phase tensor over its ODF. An ODF describes the volume fraction of crystals at each orientation.
odf_ol = calcDensity(ebsd('f').orientations,'halfwidth',10*degree);
odf_opx = calcDensity(ebsd('e').orientations,'halfwidth',10*degree);
odf_cpx = calcDensity(ebsd('d').orientations,'halfwidth',10*degree);
A phase may be selected by an unambiguous initial, as above. Use the full mineral name when two phase names start with the same letter. This route is not limited to EBSD: an ODF reconstructed from X-ray or neutron diffraction can enter the same calculation.
[CVoigt_ol,CReuss_ol,CHill_ol] = mean(C_Fo,odf_ol);
[CVoigt_opx,CReuss_opx,CHill_opx] = mean(C_opx,odf_opx);
[CVoigt_cpx,CReuss_cpx,CHill_cpx] = mean(C_cpx,odf_cpx);
The indexed phase fractions computed at the start are the weights for the multiphase mean. They sum to one, so notIndexed pixels contribute neither a tensor nor an artificial fourth phase.
[CVoigtOdf,CReussOdf,CHillOdf] = mean( ...
  [CVoigt_ol,CVoigt_opx,CVoigt_cpx],'weights',phaseFraction);

CHillOdf

plotSeismicVelocities(CHillOdf)
CHillOdf = stiffnessTensor (y←↑x)
density: 3.3449
unit : GPa
rank : 4 (3 × 3 × 3 × 3)
tensor in Voigt matrix representation:
241.9 74.33 78.24 0.71 4.68 -3.15
74.33 210.31 73.69 3.59 -0.56 -1.83
78.24 73.69 252.17 6.46 4.61 -0.32
0.71 3.59 6.46 76.83 -0.41 1.65
4.68 -0.56 4.61 -0.41 84.86 2.19
-3.15 -1.83 -0.32 1.65 2.19 74.48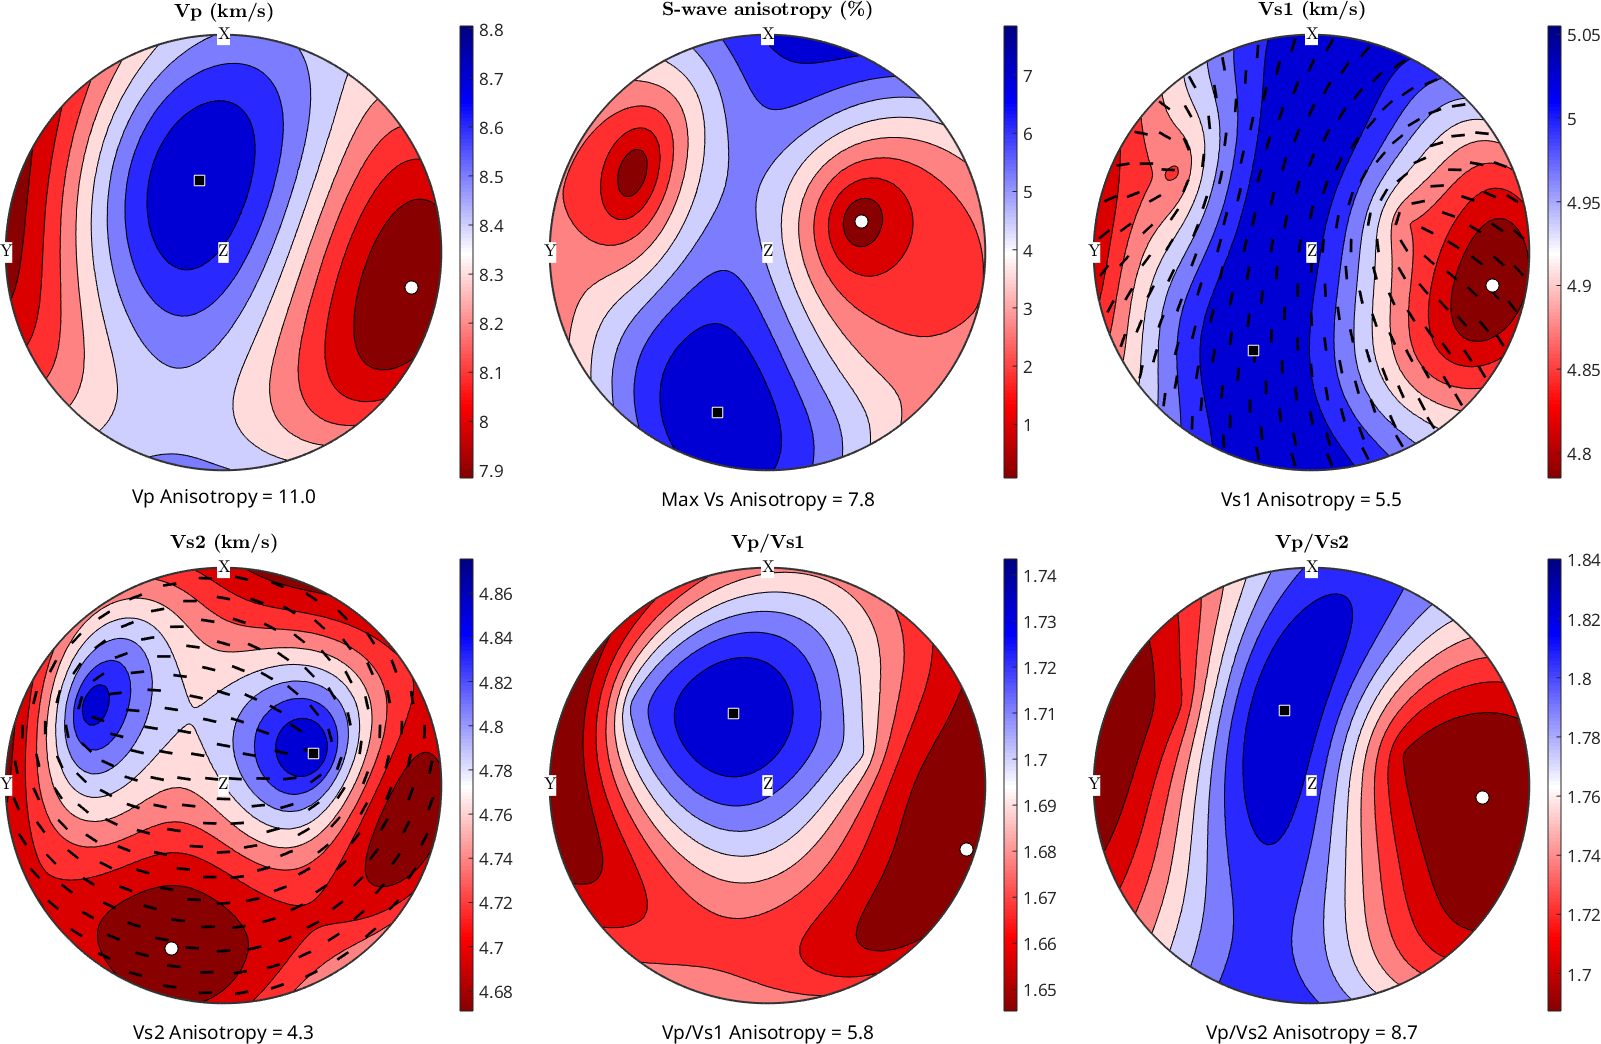
The ODF-based plot should reproduce the broad pattern of the direct EBSD average. It need not be identical because the 10 degree kernel smooths each measured orientation distribution before the tensor is averaged.
References
- E. H. Abramson, J. M. Brown, L. J. Slutsky, and J. Zaug, The elastic constants of San Carlos olivine to 17 GPa, Journal of Geophysical Research 102 (1997), 12253-12263, supplies the olivine stiffness coefficients used here.
- M. Chai, J. M. Brown, and L. J. Slutsky, The elastic constants of an aluminous orthopyroxene to 12.5 GPa, Journal of Geophysical Research 102 (1997), 14779-14785, supplies the orthopyroxene coefficients.
- D. G. Isaak, I. Ohno, and P. C. Lee, The elastic constants of monoclinic single-crystal chrome-diopside to 1,300 K, Physics and Chemistry of Minerals 32 (2006), 691-699, supplies the Diopside coefficients and their source crystal frame.
- D. Mainprice, R. Hielscher, and H. Schaeben, Calculating anisotropic physical properties from texture data using the MTEX open-source package, Geological Society, London, Special Publications 360 (2011), 175-192, develops the texture-to-property averaging workflow used on this page.
Citing this page.
This page is part of the documentation of
MTEX, a free and open
source MATLAB toolbox for analyzing and modeling crystallographic textures.
It was written by The MTEX Developers and is published at
https://mtex-toolbox.github.io/CPOSeismicProperties.html.
If you use MTEX, or reuse text or figures from this page, in your research,
please cite
F. Bachmann, R. Hielscher, H. Schaeben: Texture Analysis with MTEX - Free and Open Source Software Toolbox, Solid State Phenomena 160 (2010), 63-68. 10.4028/www.scientific.net/SSP.160.63
BibTeX
@article{bachmann2010mtex,
  author  = {F. Bachmann and R. Hielscher and H. Schaeben},
  title   = {Texture Analysis with MTEX - Free and Open Source Software Toolbox},
  journal = {Solid State Phenomena},
  volume  = {160},
  pages   = {63-68},
  year    = {2010},
  doi     = {10.4028/www.scientific.net/SSP.160.63},
  url     = {https://doi.org/10.4028/www.scientific.net/SSP.160.63}
}
Other papers describing specific MTEX methods are listed under Publications — please cite the one that best fits your application. The MTEX source code is licensed under the GNU General Public License v2.0; the text and figures of this documentation are licensed under CC BY 4.0, which permits reuse — including by automated systems — provided The MTEX Developers and this page are credited.