In this section we discuss how to analyze the neighboring relationships between grains. While most of this can be done also on the level of grain boundaries an local misorientations it is for large data sets sometimes useful to consider misorientations between the mean-orientations of grains. We shall use the following Magnesium data set of our explanations.
% load sample EBSD data set
mtexdata twins silent
CS = ebsd('indexed').CS;

% reconstruct grains
[grains, ebsd.grainId] = calcGrains(ebsd('indexed'),'angle',5*degree);

grains = smooth(grains,5);

% plot the grains
plot(grains,grains.meanOrientation)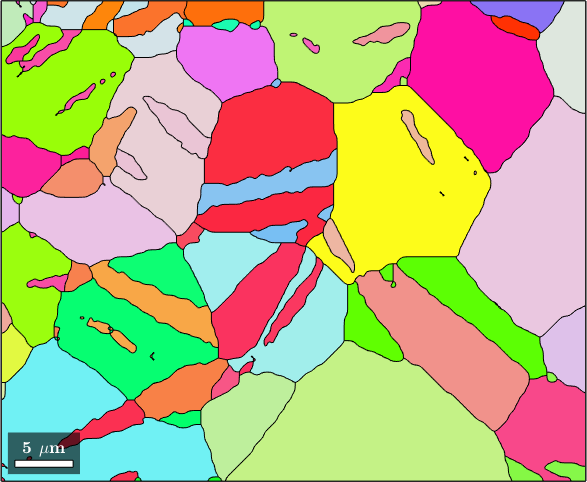
Central for the analysis of grain to grain relationships is the function grains.neighbours. It return a list of pairs of neighboring grain ids. Each row of the list contains the ids of two neighboring grains. In the following lines choose the row number 170 and outline the corresponding grains
pairs = grains.neighbors;

hold on
plot(grains(pairs(170,:)).boundary,'LineWidth',4,'linecolor','b')
hold off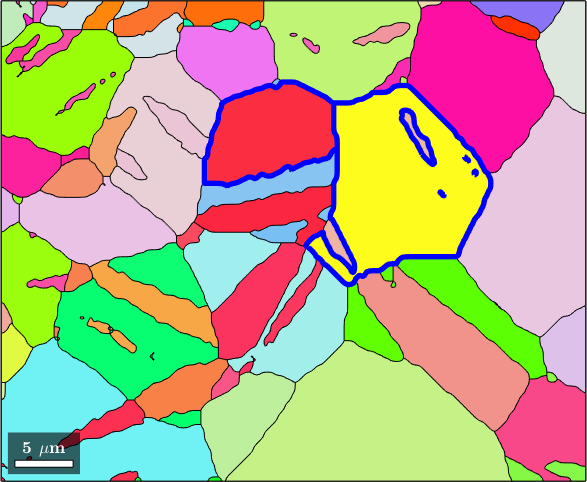
In order to compute the misorentation between these two grains we can do
mori = inv(grains(pairs(170,1)).meanOrientation) * grains(pairs(170,2)).meanOrientationmori = misorientation (Magnesium → Magnesium)
Bunge Euler angles in degree
phi1 Phi phi2
107.132 58.9845 309.493This can be generalized to compute the misorientations between neighboring grains using
mori = inv(grains(pairs(:,1)).meanOrientation) .* grains(pairs(:,2)).meanOrientation

close all
histogram(mori.angle./degree)
xlabel('misorientation angle')
mori = misorientation (Magnesium → Magnesium)
size: 251 x 1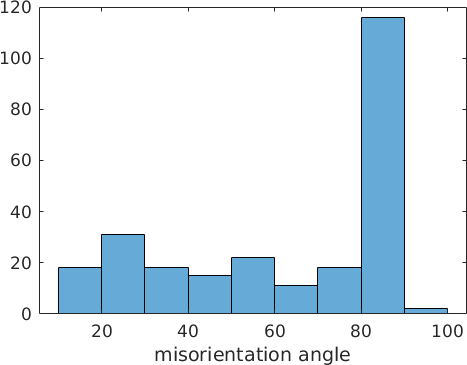
We observe a high peak at about 85 degree. This angle corresponds to twinning. In Magnesium the twinning orientation relationship is given by
twinning = orientation.map(Miller(0,1,-1,-2,CS),Miller(0,-1,1,-2,CS),...
  Miller(2,-1,-1,0,CS),Miller(2,-1,-1,0,CS))
twinning = misorientation (Magnesium → Magnesium)
(11̅01) || (101̅1) [011̅1] || [011̅1̅]In order to determine the percentage of twining pairs we do
% which of the pairs are twinning
isTwinning = angle(mori,twinning) < 3*degree;

% percentage of twinning pairs
100 * sum(isTwinning) / length(isTwinning)
ans =
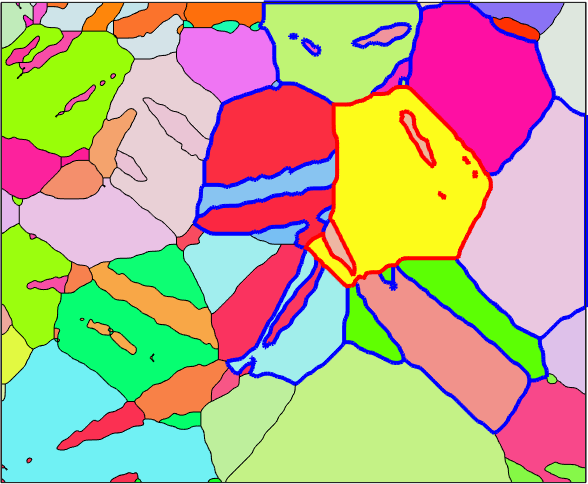
37.0518It is important to understand that the list returned by grains.neighbours contains only pairs such that both grains are contained in grains. This allows the syntax grains('phaseName') to extract only neighbor relation ships within one phase.
In some case, e.g. if we ask for all neighboring grains to a given grains, it is useful to replace this constraint by the condition that at least one grain should by part of grains. This can be accomplished by the option 'full'.
% get all pairs containing grain 83
pairs = grains(83).neighbors('full');

% remove center grain 83 from this list
pairs(pairs == 83) = [];

plot(grains,grains.meanOrientation,'micronbar','off')
hold on
plot(grains(pairs).boundary,'lineColor','blue','lineWidth',3)
hold on
plot(grains(83).boundary,'lineColor','red','lineWidth',3)
hold off