Syntax
N = Miller(1,0,1,'hkl',cs)
plotInnerFace(cS,N,'faceColor','blue','faceAlpha',0.5,'edgeColor','k')
Input
| cS | crystalShape |
| N | Miller lattice plane |
Output
| h | handle to the graphics object |
Options
| PatchProperty | all matlab patch properties |
Example
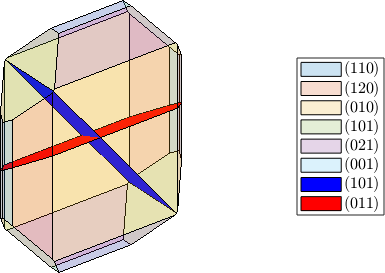
cS = crystalShape.olivine;
N = Miller(1,0,1,'hkl',cS.CS);plot(cS,'faceAlpha',0.2,'colored')
hold on
plotInnerFace(cS,N,'faceColor','blue','DisplayName','(101)')
plotInnerFace(cS,Miller(0,1,1,cS.CS),'faceColor','red','DisplayName','(011)')
hold off