Syntax
d = Miller(1,0,1,'uvw',cs)
plotInnerDirection(cS,d,'faceColor','blue','DisplayName','(101)')
Input
| cS | crystalShape |
| d | Miller crystal direction |
Output
| h | handle to the graphics object |
Options
| PatchProperty | all matlab patch properties |
Example
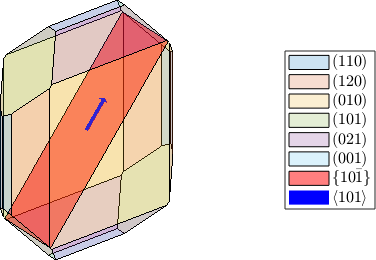
define and plot a crystal shape
cS = crystalShape.olivine;
plot(cS,'faceAlpha',0.2,'colored')
%
% define and plot a crystal plane and a crystal direction
d = Miller(1,0,1,'uvw',cS.CS);
n = Miller(1,0,-1,'hkl',cS.CS);
hold on
plotInnerFace(cS,n,'faceColor','red','DisplayName','\(\{10\bar1\}\)','faceAlpha',0.5)
plotInnerDirection(cS,d,'faceColor','blue','arrowWidth',0.05,'DisplayName','\(\langle 101 \rangle\)')
hold off