plot odf along a fibre
Syntax
plotFibre(odf,f);Input
| odf | SO3FunHarmonic |
| f | fibre |
Options
| resolution | resolution of each plot |
Example
odf = SantaFe;
f = fibre.gamma(odf.CS,odf.SS)
plotFibre(SantaFe,f)
f = fibre (m3̅m → y↑→x (222))
h || r: (111) || (0,0,1)
o1 → o2: (180°,54.7°,45°) → (270°,54.7°,45°)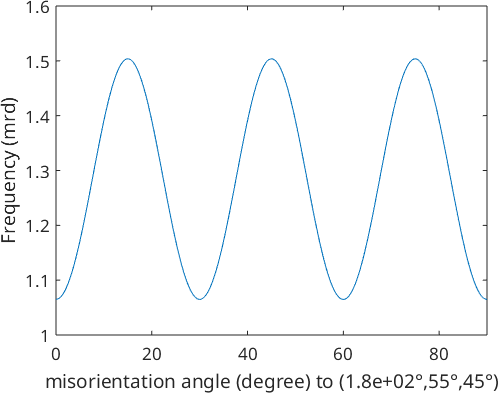
See also
S2Grid.plot savefigure Plotting Annotations_demo ColorCoding_demo PlotTypes_demo SphericalProjection_demo