Syntax
N = Miller(1,0,1,'hkl',cs)
plotInnerFace(cS,N,'faceColor','blue','faceAlpha',0.5,'edgeColor','k')
Input
Output
|
h
|
handle to the graphics object
|
Options
Example
cs = crystalSymmetry.load('Mg-Magnesium.cif');
cS = crystalShape.hex(cs)
sS = [slipSystem.pyramidal2CA(cs), ...
slipSystem.pyramidalA(cs)];
cS = crystalShape
 mineral: Mg (6/mmm, X||a*, Y||b, Z||c*)
 vertices: 12
 faces: 8
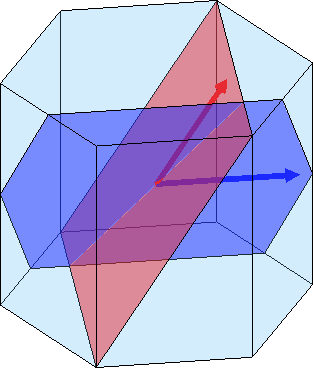
plot(cS,'faceAlpha',0.2)
hold on
plot(cS,sS(2),'faceColor','blue')
plot(cS,sS(1),'faceColor','red')
hold off
See also
CrystalShapes