colorize grains
Syntax
plot(cS)
plot(cS,'colored') % colorize different faces
plot(cS,'colored',ipfKey)
plot(x,y,cS)
plot(x,y,z,cS)
plot(xy,cS)
plot(cS,'faceColor','red','faceAlpha',0.5,'edgeColor','k') % colorize by property
plot(cS,'faceColor',cS.faceAraea)
% plot an inner plane
plot(cS, Miller(1,1,0,cS.CS,'hkl'))% visualize a slip system
plot(cS, sS)Input
| cS | crystalShape |
| x,y | coordinates |
| xy | nx2 or nx3 coordinate matrix |
| sS | slipSystem |
Output
| h | graphics handle |
Options
| PatchProperty | all matlab patch properties |
Example
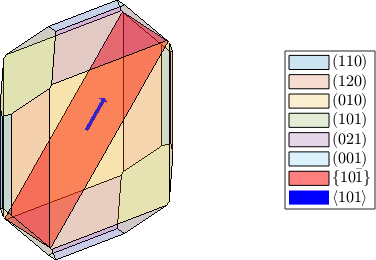
define and plot a crystal shape
cS = crystalShape.olivine;
plot(cS,'faceAlpha',0.2,'colored')
%
% define and plot a crystal plane and a crystal direction
d = Miller(1,0,1,'uvw',cS.CS);
n = Miller(1,0,-1,'hkl',cS.CS);
hold on
plotInnerFace(cS,n,'faceColor','red','DisplayName','\(\{10\bar1\}\)','faceAlpha',0.5)
plotInnerDirection(cS,d,'faceColor','blue','arrowWidth',0.05,'DisplayName','\(\langle 101 \rangle\)')
hold off