select EBSD data along line segments
Syntax
ebsdLine = spatialProfile(ebsd,[xStart,xEnd],[yStart yEnd])[ebsdLine,dist] = spatialProfile(ebsd,x,y)xy = ginput(2)
[ebsdLine,dist] = spatialProfile(ebsd,xy)Input
| ebsd | EBSD |
| xStart, xEnd, yStart, yEnd | double |
| x, y | coordinates of the line segments |
| xy | list of spatial coordinates |[x(:) y(:)]| |
Output
| ebsdLine | EBSD restricted to the line of interest |
| dist | double distance along the line to the initial point |
Example
import data
mtexdata twinsebsd = EBSD (y↑→x)
Phase Orientations Mineral Color Symmetry Crystal reference frame
0 46 (0.2%) notIndexed
1 22833 (100%) Magnesium LightSkyBlue 6/mmm X||a*, Y||b, Z||c*
Properties: bands, bc, bs, error, mad
Scan unit : um
X x Y x Z : [0, 50] x [0, 41] x [0, 0]
Normal vector: (0,0,1)plot data
plot(ebsd('indexed'),ebsd('indexed').orientations)
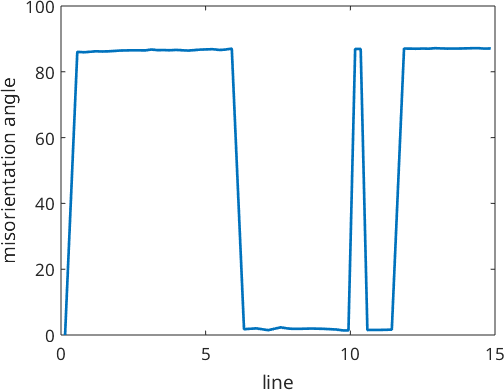
select line coordinates
x = [15.5 27]; y = [20.5 11];draw line with some translucency
line(x,y,'color',[0.5 0.5 0.5 0.5],'linewidth',10)
restrict ebsd data to this line
[ebsdLine,dist] = spatialProfile(ebsd,x,y);extract orientations
ori = ebsdLine.orientations;figure
% plot misorientation angle along the profile
plot(dist,angle(ori,ori(1))./degree,'linewidth',2)
xlabel('line'), ylabel('misorientation angle')