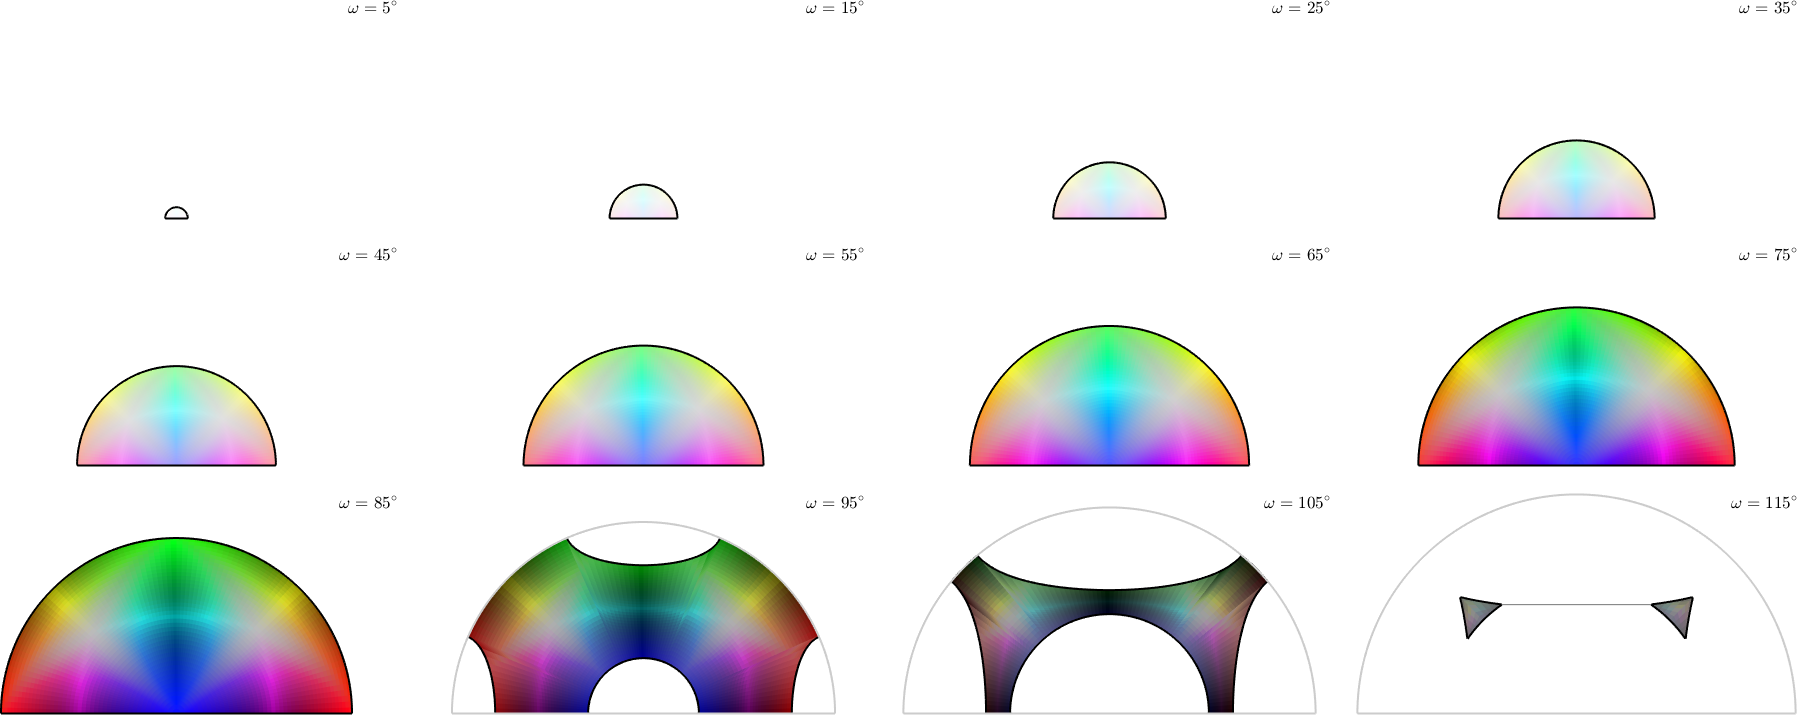
orientationPlot edit page

ODFSECTIONS

Syntax

oP = orientationPlot(ax,CS1,varargin)

Example

cs = crystalSymmetry('mmm')
oS = axisAngleSections(cs,cs)
ori = oS.makeGrid('resolution',2*degree);
oM = PatalaColorKey(cs,cs)
rgb = oM.orientation2color(ori);
plot(oS,rgb,'surf')
cs = crystalSymmetry
 
  symmetry: mmm    
  elements: 8      
  a, b, c : 1, 1, 1
 
oS = 
  axisAngleSections with properties:

           angles: [0.0873 0.2618 0.4363 0.6109 0.7854 0.9599 1.1345 … ]
      axesSectors: {1×12 cell}
          jointCS: [1×1 crystalSymmetry]
               oR: [1×1 orientationRegion]
    volumeScaling: 1
              CS1: [1×1 crystalSymmetry]
              CS2: [1×1 crystalSymmetry]
              tol: 0.0831
         plotGrid: []
         gridSize: []
               CS: [1×1 crystalSymmetry]
               SS: [1×1 crystalSymmetry]
oM = 
  PatalaColorKey with properties:

          CS1: [1×1 crystalSymmetry]
          CS2: [1×1 crystalSymmetry]
    antipodal: 1