Inserts a scale bar on the current ebsd or grain map.
Above the bar and its label the same box also indicates how the specimen reference frame is aligned on screen: an arrow for every axis that has a component within the screen plane, and a circled dot / circled cross for the axis pointing out of / into the screen. This can be switched off by the option 'refFrame','off' or globally by setMTEXpref('showRefFrame','off').
The scale bar reads the plotting convention back from the axes camera via plottingConvention.getView and realigns itself whenever the map is reoriented, e.g. via plottingConvention.setView or one of plotx2north, plotzOutOfPlane, etc. - this works no matter which plottingConvention object was used to apply the view, since it never relies on a cached reference to it. The reference frame indicator is derived from that same convention, so it always shows the alignment actually in effect.
Syntax
sB = scaleBar(mP, scanUnit)
sB = scaleBar(mP, scanUnit, 'SBBackgroundColor', 'k', 'SBLineColor', 'w', ...
  'SBBackgroundAlpha', 0.6, 'Location', 'nw')
Input
| mP | the mapPlot the scale bar is attached to |
| scanUnit | units of the xy coordinates of the ebsd scan (e.g., 'um') |
Options
| SBBackgroundColor | background color (ColorSpec) |
| SBBackgroundAlpha | background transparency (scalar 0<=a<=1) |
| SBLineColor | border and text color (ColorSpec) |
| Length | fixed scale bar length (in scanUnit units); if not given (default) a nice round length close to 10% of the map width is chosen automatically and kept up to date as the map is zoomed or resized |
| Location | corner of the map the bar is drawn in: 'sw' (default), 'se', 'nw', 'ne' |
| refFrame | 'on' / 'off' - show the reference frame, defaults to the |showRefFrame| preference |
| refFrameDirs | vector3d, the directions to indicate (default xvector, yvector, zvector) |
| refFrameLabels | cell of char, their labels; default are the axes names of the frame the data lives in, e.g. X1, Y1, Z1 or RD, TD, ND |
Example
use a scale bar on the aachen mtexdata
mtexdata aachen
plot(ebsd,'SBBackgroundColor','k','SBLineColor','w', ...
'SBBackgroundAlpha',0.6,'Location','nw')
ebsd = EBSDsquare (y↓→x, row↓→col)
Phase Orientations Mineral Color Symmetry Crystal reference frame
0 11411 (19%) notIndexed none
1 48184 (79%) Fe LightSkyBlue m-3m
2 1180 (1.9%) Mg DarkSeaGreen m-3m
Properties: bands, bc, bs, error, index, mad, reliabilityindex, oldId
Scan unit : um
X × Y × Z : [0 → 254] × [90 → 175] × [0 → 0]
Normal vector: (0,0,1)
Square grid :143 × 425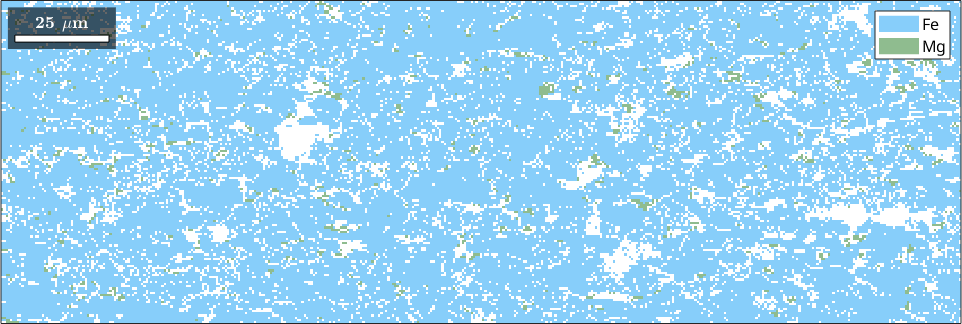
Citing this page.
This page is part of the documentation of
MTEX, a free and open
source MATLAB toolbox for analyzing and modeling crystallographic textures.
It was written by The MTEX Developers and is published at
https://mtex-toolbox.github.io/scaleBar.html.
If you use MTEX, or reuse text or figures from this page, in your research,
please cite
F. Bachmann, R. Hielscher, H. Schaeben: Texture Analysis with MTEX - Free and Open Source Software Toolbox, Solid State Phenomena 160 (2010), 63-68. 10.4028/www.scientific.net/SSP.160.63
BibTeX
@article{bachmann2010mtex,
  author  = {F. Bachmann and R. Hielscher and H. Schaeben},
  title   = {Texture Analysis with MTEX - Free and Open Source Software Toolbox},
  journal = {Solid State Phenomena},
  volume  = {160},
  pages   = {63-68},
  year    = {2010},
  doi     = {10.4028/www.scientific.net/SSP.160.63},
  url     = {https://doi.org/10.4028/www.scientific.net/SSP.160.63}
}
Other papers describing specific MTEX methods are listed under Publications — please cite the one that best fits your application. The MTEX source code is licensed under the GNU General Public License v2.0; the text and figures of this documentation are licensed under CC BY 4.0, which permits reuse — including by automated systems — provided The MTEX Developers and this page are credited.