Syntax
rgb = spectralTransmission(rI,vprop,p,thickness)
rgb = spectralTransmission(rI,vprop,p,thickness,'polarizationDirection',p)
rgb = spectralTransmission(rI,vprop,p,thickness,'phi',phi)
plot(rI.spectralTransmission(thickness))
Input
|
rI
|
refractiveIndexTensor
|
|
vprop
|
propagation direction
|
|
thickness
|
|
|
p
|
direction of the polarizer
|
|
tau
|
angle between polarizer and analyzer
|
Example
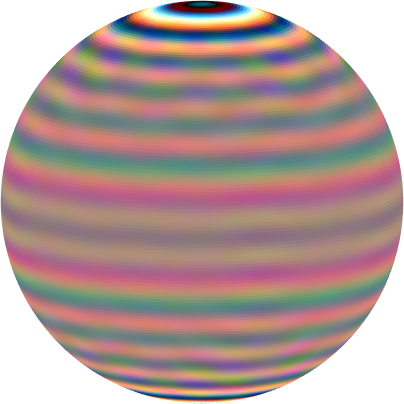
thickness = 20000;
rI = refractiveIndexTensor.calcite
plot(rI.spectralTransmission(thickness),'rgb','3d')
rI = refractiveIndexTensor (Calcite)
  rank: 2 (3 x 3)

  1.66     0     0
     0  1.66     0
     0     0 1.486