
A grain combines several kinds of information: an identity, scalar properties, a mean orientation, an outline, and a place in the boundary network. No single exchange format on this page preserves all of them. Choose the representation that the receiving program needs, and record the information required to interpret it.
This page assumes that grains have already been reconstructed as in Grain Reconstruction. The examples use the Forsterite data set. Exporting a picture instead of the underlying data is covered in Exporting Plots.
import csv
import os
import tempfile
import matplotlib.pyplot as plt
import numpy as np
from mtex import *
plottingConvention.default('y↑→x')
ebsd = mtexdata('forsterite')

grainsRaw = calcGrains(ebsd, angle=10 * degree)

# remove grains with ten or fewer measurements
grainsRaw = grainsRaw[grainsRaw.numPixel > 10]
grainsRaw
grain2d (y↑→x)
  size: 745
  Phase  Grains               Mineral     Color         Symmetry  Crystal reference frame
  0      10 (903 pixels)      notIndexed
  1      443 (151149 pixels)  Forsterite  LightSkyBlue  mmm       Forsterite
  2      185 (25457 pixels)   Enstatite   DarkSeaGreen  mmm       Enstatite
  3      107 (6962 pixels)    Diopside    Goldenrod     12/m1     Diopside
  boundary segments: 44271, inner: 173, triple points: 3418
Record how the grains were made
The displayed summary identifies the phases and the number of grains that will be exported. The cutoff above and the 10 degree reconstruction threshold are also part of the result. Record them with the source map, the MTEX version, and any other processing choices.
Smoothing changes polygon coordinates, areas, perimeters, and segment lengths. It does
not change grain IDs, pixel counts, or mean orientations. We therefore keep grainsRaw
for measurement-level boundary data and use a smoothed copy for shape data.
grains = smoothBoundary(grainsRaw, 5)
Export a grain table
A table collects one row per grain, here as a dictionary of columns that the csv
module writes for a spreadsheet or a statistics package.
A grain ID is a persistent label, not the row number in a subset. The distinction is
demonstrated in Selecting Grains. The phase property is the
numeric phase value imported with the map, so the readable mineral name is exported as a
separate column. A grain with no data on one side of it has truncated geometry. The
isBoundary column lets the receiver identify those grains instead of silently
treating their visible area and perimeter as complete. isBoundary flags every grain
that owns a segment with no grain on the other side. That covers the grains at the map
edge and the grains around an unindexed region inside the map.
Lengths are in the map’s measurement unit and areas in its square. This map uses micrometres, so the unit is included in each relevant column name. Shape Parameters defines these quantities. Any other scalar grain property can be appended in the same way.
mineralList = grains.mineralList
mineral = [mineralList[p] for p in grains.phaseId]

T = {'id': grains.id, 'phase': grains.phase, 'mineral': mineral, 'isBoundary': grains.isBoundary, 'numPixel': grains.numPixel,
     'area_um2': grains.area, 'perimeter_um': grains.perimeter, 'equivalentRadius_um': grains.equivalentRadius, 'GOS_degree': grains.GOS / degree}


def head(T, n=8):
  keys = list(T)
  print(''.join(f'{k:>20}' for k in keys))
  for i in range(min(n, len(T[keys[0]]))):
    print(''.join(f'{T[k][i]:>20.5g}' if isinstance(T[k][i], (float, np.floating)) else f'{str(T[k][i]):>20}' for k in keys))


head(T)
                  id               phase             mineral          isBoundary            numPixel            area_um2        perimeter_um equivalentRadius_um          GOS_degree
                   1                   1          Forsterite                True                2550          6.4952e+06               11839              1437.9             0.56822
                   2                   1          Forsterite                True                  87          2.1421e+05              2146.7              261.12             0.87692
                   3                   2           Enstatite                True                  15               42518              996.05              116.33             0.24992
                   5                   1          Forsterite                True                 427          1.2105e+06              4560.9              620.74             0.53336
                   6                   1          Forsterite                True                  66           2.417e+05              2350.9              277.37             0.52244
                   8                   1          Forsterite                True                 121          3.4932e+05                2743              333.46              1.9631
                   9                   1          Forsterite                True                 700          1.9743e+06              6209.3              792.74              2.0452
                  10                   1          Forsterite                True                  12               27635              877.76              93.789             0.21636
Add mean orientations
An orientation row needs one crystal symmetry. We therefore restrict the table and both grain lists to Forsterite before adding Euler angles. Naming the Bunge convention and degree in the headings removes two common ambiguities.
grains = grains['Forsterite']
grainsRaw = grainsRaw['Forsterite']
keep = np.array([m == 'Forsterite' for m in T['mineral']])
T = {k: np.asarray(v)[keep] for k, v in T.items()}

phi1, Phi, phi2 = grains.meanOrientation.Euler('Bunge')

T['phi1_Bunge_degree'] = phi1 / degree
T['Phi_Bunge_degree'] = Phi / degree
T['phi2_Bunge_degree'] = phi2 / degree

csvFile = os.path.join(tempfile.gettempdir(), 'grains.csv')
with open(csvFile, 'w', newline='') as f:
  writer = csv.writer(f)
  writer.writerow(T.keys())
  writer.writerows(zip(*T.values()))

with open(csvFile) as f:
  rows = list(csv.reader(f))
head({k: [float(r[i]) if k not in ('mineral', 'isBoundary') else r[i] for r in rows[1:]] for i, k in enumerate(rows[0])})
                  id               phase             mineral          isBoundary            numPixel            area_um2        perimeter_um equivalentRadius_um          GOS_degree   phi1_Bunge_degree    Phi_Bunge_degree   phi2_Bunge_degree
                   1                   1          Forsterite                True                2550          6.4952e+06               11839              1437.9             0.56822              95.892              42.532              292.81
                   2                   1          Forsterite                True                  87          2.1421e+05              2146.7              261.12             0.87692              170.36              153.19              279.13
                   5                   1          Forsterite                True                 427          1.2105e+06              4560.9              620.74             0.53336              168.19              58.055              242.61
                   6                   1          Forsterite                True                  66           2.417e+05              2350.9              277.37             0.52244              175.12              31.094              263.33
                   8                   1          Forsterite                True                 121          3.4932e+05                2743              333.46              1.9631              158.97              110.06              265.58
                   9                   1          Forsterite                True                 700          1.9743e+06              6209.3              792.74              2.0452               57.41              162.62              335.06
                  10                   1          Forsterite                True                  12               27635              877.76              93.789             0.21636               137.2              161.48              224.95
                  11                   1          Forsterite                True                 291          7.6353e+05              4484.7              492.99              3.9132              137.45              88.411              238.52
The reloaded rows retain their values and descriptive headings. Adding the orientation columns makes the table self-contained only when the receiving program also knows the Forsterite crystal symmetry and the crystal and specimen reference frames. A reference frame is the frame in which the data are expressed.
A CSV file has no standard place for this context. Accompany it with a README or structured metadata that records the source, phase symmetries, spatial and angular units, Euler convention, reference frames, reconstruction threshold, size cutoff, and boundary smoothing.
Export mean orientations
When only the orientations are needed, export writes a compact ASCII table. Its
conventions and limitations are described in
Exporting Crystal Orientations.
orientationFile = os.path.join(tempfile.gettempdir(), 'grainOrientations.txt')
export(grains.meanOrientation, orientationFile, 'Bunge')

with open(orientationFile) as f:
  for k in range(3):
    print(f.readline().rstrip())
    phi1     Phi    phi2
 95.8915  42.532 292.806
 170.361 153.188 279.133
The first line identifies the three Euler columns, and the following rows contain Bunge angles in degree. Crystal symmetry and reference frames are not stored in this file.
A dictionary appends one column per entry. Every entry must have one value per orientation, so grain properties remain aligned with their mean orientations.
S = {'area_um2': grains.area, 'GOS_degree': grains.GOS / degree}

export(grains.meanOrientation, orientationFile, S, 'Bunge')

with open(orientationFile) as f:
  for k in range(3):
    print(f.readline().rstrip())
    phi1     Phi    phi2    area_um2 GOS_degree
 95.8915  42.532 292.806  6.4952e+06   0.568221
 170.361 153.188 279.133      214213   0.876925
Export a VPSC texture
export with interface='VPSC' writes the weighted texture format used by the VPSC crystal-plasticity
code. It accepts Bunge, Kocks, or Roe Euler angles and normalises the supplied weights
to sum to one.
Here the weights are observed areas on a two-dimensional section. Treating those area fractions as three-dimensional volume fractions is a modelling assumption, not a conversion performed by MTEX.
vpscFile = os.path.join(tempfile.gettempdir(), 'grains.tex')
export(grains.meanOrientation, vpscFile, 'Bunge', interface='VPSC', weights=grains.area)

vpscData = np.loadtxt(vpscFile, skiprows=4)
writtenWeightSum = np.sum(vpscData[:, 3])
writtenWeightSum
1.0000
The printed sum is one to the precision stored in the text file. The VPSC header also records the Euler convention and number of orientations, but the phase symmetry and reference frames still need companion metadata.
Export polygon geometry
Each grain outline is stored as one or more closed loops. The property grains.loops
holds, for every grain, its loops as lists of vertex indices in walk order. These
indices refer to grains.V, the vertex list of the grains.
A grain that encloses another grain has an outer loop followed by one or more inner loops. This is the same enclosure described from the outside as a hole and from the inside as an inclusion. A loop is written with its first vertex repeated at the end.
V = grains.V
firstInterior = int(np.flatnonzero(~grains.isBoundary)[0])
poly = np.append(grains.loops[firstInterior][0], grains.loops[firstInterior][0][0])
polyVertexCount = len(poly)
polyVertexCount
17
xy = V[poly]
xy[:5]
array([[7475.    ,  325.    ],
       [7425.65  ,  307.9   ],
       [7379.6875,  288.5417],
       [7344.7174,  261.8551],
       [7325.    ,  225.    ]])
newMtexFigure(figSize=(4, 4))
plot(grains[firstInterior], faceColor='LightSkyBlue', micronbar=False)
hold(True)
plt.plot(xy[:, 0], xy[:, 1], 'k.', markersize=6)
hold(False)
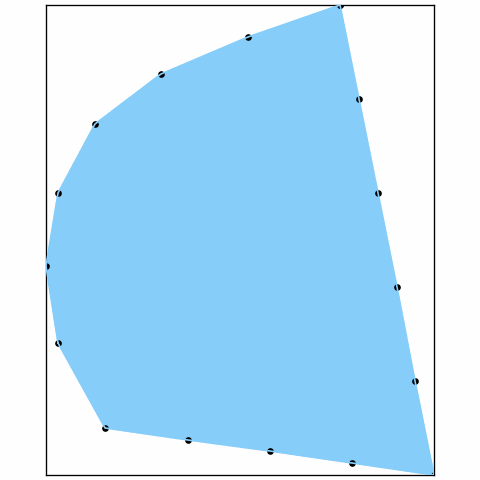
The blue area is the first grain that does not touch the map edge. The black markers trace the vertex walk that will be written, including the repeated endpoint that closes the loop. These are smoothed coordinates, not the original pixel staircase.
The following file contains every loop of every Forsterite grain. Both grainId and
loopId are needed: a grain ID groups loops into grains, while a loop ID keeps an outer
outline separate from enclosure outlines.
polygonFile = os.path.join(tempfile.gettempdir(), 'grainPolygons.txt')
with open(polygonFile, 'w') as f:
  f.write('% grainId loopId x_um y_um\n')
  for k in range(len(grains)):
    for loopId, loop in enumerate(grains.loops[k], start=1):
      q = np.append(loop, loop[0])
      for x, y in V[q]:
        f.write(f'{grains.id[k]} {loopId} {x:.17g} {y:.17g}\n')

with open(polygonFile) as f:
  for k in range(4):
    print(f.readline().rstrip())
% grainId loopId x_um y_um
1 1 175 1975
1 1 174.37286376953125 1925.6027221679688
1 1 170.58982849121094 1879.0847778320312
Export the boundary network
A grain boundary is a segment between two neighbouring EBSD measurements that belong to different grains. The boundary table below uses the unsmoothed network so each row retains that measurement-level meaning. It excludes segments next to grains removed by the size cutoff.
gB = grainsRaw.boundary['Forsterite', 'Forsterite']
gB = gB[np.all(np.isin(gB.grainId, grainsRaw.id), axis=1)]

TB = {'grainA': gB.grainId[:, 0], 'grainB': gB.grainId[:, 1], 'segLength_um': gB.segLength,
      'segmentDisorientation_degree': gB.misorientation.angle() / degree}

head(TB)
              grainA              grainB        segLength_umsegmentDisorientation_degree
                1294                1386                  50               51.26
                1294                1386              35.355              51.325
                1294                1386              35.355              51.382
                1294                1386                  50                51.2
                1294                1386              35.355              50.644
                1294                1386              35.355              50.694
                1294                1386                  50              50.907
                1294                1386                  50              50.987
gB stores one row per boundary segment. The two IDs identify its neighbouring grains.
The angle is the disorientation between the adjacent measurements across that segment,
not the disorientation between the two grain mean orientations. Continue with
Grain Boundary Properties before exporting further segment
quantities.
Save the objects
If the data will be read by the same installation, Python’s pickle preserves the
complete objects more conveniently than separate text tables, as MATLAB’s save does.
Saving the source map with both grain lists keeps the measurements available for later
checks; the processing history still belongs in the companion metadata. Such pickles
are not readable by other software and are not guaranteed to load in a future version.
For long-term archiving, prefer documented ASCII tables such as those above together
with the source data and companion metadata. No one of these tables replaces the
complete objects.
Remove the temporary files created by this page.
for f in (csvFile, orientationFile, vpscFile, polygonFile):
  os.remove(f)
Further reading
- ISO 13067:2020, Microbeam analysis - Electron backscatter diffraction - Measurement of average grain size, distinguishes measurements on a two-dimensional section from inferences about three-dimensional grain size.
- H.-J. Bunge, Texture Analysis in Materials Science: Mathematical Methods, Butterworths, English ed., 1982, establishes the Euler-angle convention used in texture analysis.
- R. A. Lebensohn and C. N. Tomé, A self-consistent anisotropic approach for the simulation of plastic deformation and texture development of polycrystals, Acta Metallurgica et Materialia 41 (1993), 2611-2624, introduces the VPSC formulation.
- M. D. Wilkinson et al., The FAIR Guiding Principles for scientific data management and stewardship, Scientific Data 3 (2016), 160018, explains why reusable data need rich metadata and provenance.
Next
Neper Interface follows this page in the chapter and constructs synthetic polycrystals for simulation. For measured grain boundaries, continue with Grain Boundaries.
Technical details
MATLAB’s table and writetable are a dictionary of columns and the csv module,
readtable the same module reading; head is a small function of the page. The grain
loops are grains.loops, lists of index arrays into grains.V without the closing
vertex, where MATLAB’s poly concatenates the loops with their first vertex repeated
and indexes allV. MATLAB’s save is Python’s pickle.
Citing this page.
This page is part of the documentation of
MTEX, a free and open
source MATLAB toolbox for analyzing and modeling crystallographic textures.
It was written by The MTEX Developers and is published at
https://mtex-toolbox.github.io/GrainExport_py.html.
If you use MTEX, or reuse text or figures from this page, in your research,
please cite
F. Bachmann, R. Hielscher, H. Schaeben: Texture Analysis with MTEX - Free and Open Source Software Toolbox, Solid State Phenomena 160 (2010), 63-68. 10.4028/www.scientific.net/SSP.160.63
BibTeX
@article{bachmann2010mtex,
  author  = {F. Bachmann and R. Hielscher and H. Schaeben},
  title   = {Texture Analysis with MTEX - Free and Open Source Software Toolbox},
  journal = {Solid State Phenomena},
  volume  = {160},
  pages   = {63-68},
  year    = {2010},
  doi     = {10.4028/www.scientific.net/SSP.160.63},
  url     = {https://doi.org/10.4028/www.scientific.net/SSP.160.63}
}
Other papers describing specific MTEX methods are listed under Publications — please cite the one that best fits your application. The MTEX source code is licensed under the GNU General Public License v2.0; the text and figures of this documentation are licensed under CC BY 4.0, which permits reuse — including by automated systems — provided The MTEX Developers and this page are credited.