
colour orientations by the crystal direction parallel to a chosen specimen direction
Syntax
key = ipfColorKey(cs)
key.ipfDirection = xvector
rgb = key.orientation2color(ori)
key.plot()
Description
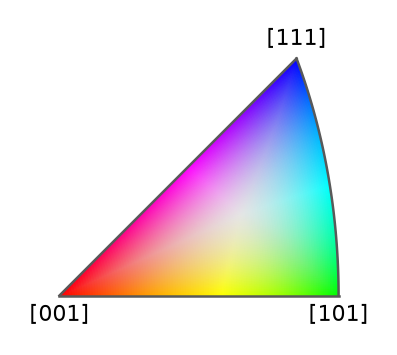
For each orientation, the inverse rotation carries ipfDirection into crystal coordinates. The direction key then folds that crystal direction into its fundamental sector and assigns a colour. Thus the same colour identifies the same crystal axis along the selected specimen direction. An inverse pole figure colour alone does not determine the full orientation.
Input
x |
crystalFrame, orientation, or single-phase EBSD or grain data |
ipfDirection |
vector3d specimen direction; default zvector |
dirMap |
direction colour key; default HSVDirectionKey of the crystal frame |
Output
key |
ipfColorKey |
Properties
ipfDirection |
specimen direction used for colouring |
dirMap |
direction colour key used for crystal directions |
CS |
crystal frame of the key |
Example
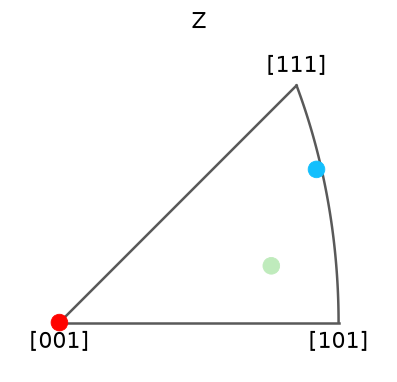
Choose specimen Z as the colouring direction, then colour three orientations and plot the matching key and inverse poles. All inputs are constructed here; no EBSD file is needed.
import numpy as np
import matplotlib.pyplot as plt
from mtex import crystalFrame, orientation, ipfColorKey, vector3d, degree, plotIPF

cs = crystalFrame('m-3m')
ori = orientation.byEuler(np.array([[0, 0, 0], [25, 35, 15], [60, 50, 30]])*degree, cs)
key = ipfColorKey(cs)
key.ipfDirection = vector3d.Z
rgb = key.orientation2color(ori)
print('RGB colours:', np.round(rgb, 3))
key.plot()
plotIPF(ori, rgb, vector3d.Z, all=True, markerSize=10)
plt.show()
The first figure is the colour key; the second places the same colours at the crystal directions parallel to specimen Z. Changing ipfDirection changes which crystal direction is coloured.
RGB colours: [[1.    0.01  0.   ]
 [0.748 0.922 0.737]
 [0.076 0.749 0.993]]
See also
ipfHSVKey, ipfTSLKey, ipfHKLKey, ipfColorKey.orientation2color
Members
| crystalDirection | the crystal directions along the specimen direction of every orientation |
| orientation2color | convert orientations to inverse pole figure RGB colours |
| plot | the direction key drawn on its sector, or with complete=True over the whole sphere |
| precompute | the direction key evaluated once on a grid of the whole sphere, so that the colours of many orientations are cheap |
| whiteCenter | the white centre of the direction key |
Used on
CrystalShapes, EBSD3Plotting, Grains3DProperties, EBSD2ODF, EBSDDenoising, EBSDGROD, EBSDKAM, EBSDPlotting, EBSDPseudoSymmetry, EBSDSharpPlot, EBSDSimulation, BoundaryCurvature
MATLAB’s ipfColorKey_index
source
Citing this page.
This page is part of the documentation of
MTEX, a free and open
source MATLAB toolbox for analyzing and modeling crystallographic textures.
It was written by The MTEX Developers and is published at
https://mtex-toolbox.github.io/ipfColorKey_index_py.html.
If you use MTEX, or reuse text or figures from this page, in your research,
please cite
F. Bachmann, R. Hielscher, H. Schaeben: Texture Analysis with MTEX - Free and Open Source Software Toolbox, Solid State Phenomena 160 (2010), 63-68. 10.4028/www.scientific.net/SSP.160.63
BibTeX
@article{bachmann2010mtex,
  author  = {F. Bachmann and R. Hielscher and H. Schaeben},
  title   = {Texture Analysis with MTEX - Free and Open Source Software Toolbox},
  journal = {Solid State Phenomena},
  volume  = {160},
  pages   = {63-68},
  year    = {2010},
  doi     = {10.4028/www.scientific.net/SSP.160.63},
  url     = {https://doi.org/10.4028/www.scientific.net/SSP.160.63}
}
Other papers describing specific MTEX methods are listed under Publications — please cite the one that best fits your application. The MTEX source code is licensed under the GNU General Public License v2.0; the text and figures of this documentation are licensed under CC BY 4.0, which permits reuse — including by automated systems — provided The MTEX Developers and this page are credited.