
a fibre ODF, symmetric about the fibre of the orientations taking a crystal direction to a specimen direction, its shape a kernel on the sphere
Syntax
odf = fibreODF(h, r)
The de la Vallee Poussin kernel of halfwidth 10 degree.
odf = fibreODF(h, r, halfwidth=15*degree)
Another halfwidth.
odf = fibreODF(h, r, psi)
The S2 kernel psi, also kernel=psi.
odf = fibreODF(h, r, ss)
The specimen frame named.
odf = fibreODF(f, weights=w)
From a fibre f, one weight per fibre.
Description
The ODF is SO3FunCBF, the kernel of the angle between g h and r, the weights normalised to a mean of one. Several crystal and specimen directions give several fibres.
Input
h |
Miller, the crystal directions, or a fibre |
r |
vector3d, the specimen directions |
args |
specimenFrame and an S2Kernel |
Keywords
| keyword | default | description |
|---|---|---|
kernel |
None |
S2Kernel, the shape; by default the de la Vallee Poussin kernel |
halfwidth |
None |
the halfwidth of the default kernel, 10 degree unless given |
weights |
None |
one weight per fibre |
Output
odf |
SO3FunCBF |
Example
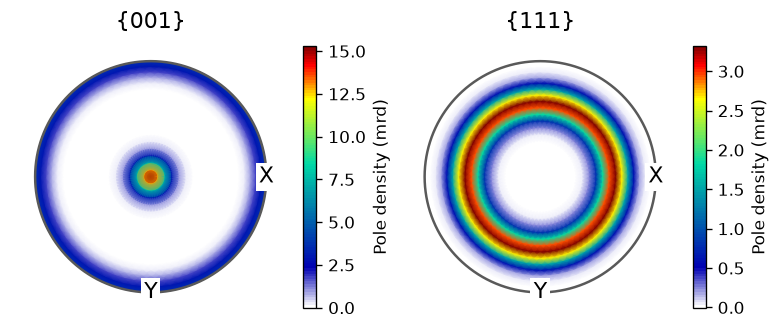
Construct a cubic <001> fibre texture about specimen Z and display its {001} and {111} pole figures. The halfwidth is explicit and no data file is needed.
import matplotlib.pyplot as plt
from mtex import crystalFrame, Miller, vector3d, fibreODF, degree, plotPF, mtexColorbar

cs = crystalFrame('m-3m')
h = Miller(0, 0, 1, cs, 'uvw')
odf = fibreODF(h, vector3d.Z, halfwidth=10*degree)
print('ODF mean:', round(float(odf.mean()), 6))
plotPF(odf, [Miller(0, 0, 1, cs), Miller(1, 1, 1, cs)], antipodal=True, resolution=5*degree)
mtexColorbar(title='Pole density (mrd)')
plt.show()
The fibre aligns a crystal direction with a specimen direction while allowing rotation around it. The ODF has mean one over orientation space. Central peaks and rings in the pole figures reflect that rotational freedom; a unimodalODF instead centres on one full orientation.
ODF mean: 1.0
See also
unimodalODF, uniformODF, FourierODF, BinghamODF, SO3FunCBF, FibreODFs
Used on
OrientationFibre, ClusterDemo, OptimalKernel, BinghamODFs, EulerAngleSections, FibreODFs, ODFCharacteristics, ODFExport, ODFInversePoleFigure, ODFPlot, ODFPoleFigure, RandomSampling
MATLAB’s fibreODF
source
Citing this page.
This page is part of the documentation of
MTEX, a free and open
source MATLAB toolbox for analyzing and modeling crystallographic textures.
It was written by The MTEX Developers and is published at
https://mtex-toolbox.github.io/fibreODF_py.html.
If you use MTEX, or reuse text or figures from this page, in your research,
please cite
F. Bachmann, R. Hielscher, H. Schaeben: Texture Analysis with MTEX - Free and Open Source Software Toolbox, Solid State Phenomena 160 (2010), 63-68. 10.4028/www.scientific.net/SSP.160.63
BibTeX
@article{bachmann2010mtex,
  author  = {F. Bachmann and R. Hielscher and H. Schaeben},
  title   = {Texture Analysis with MTEX - Free and Open Source Software Toolbox},
  journal = {Solid State Phenomena},
  volume  = {160},
  pages   = {63-68},
  year    = {2010},
  doi     = {10.4028/www.scientific.net/SSP.160.63},
  url     = {https://doi.org/10.4028/www.scientific.net/SSP.160.63}
}
Other papers describing specific MTEX methods are listed under Publications — please cite the one that best fits your application. The MTEX source code is licensed under the GNU General Public License v2.0; the text and figures of this documentation are licensed under CC BY 4.0, which permits reuse — including by automated systems — provided The MTEX Developers and this page are credited.