
A direction file is only a table of numbers until its coordinate columns are identified. vector3d.load turns those columns into a vector3d array.
This page assumes that polar angle and azimuth are familiar. See Defining Three-Dimensional Vectors for their definitions and for the distinction between vectors and directions.
from mtex import *
plottingConvention.default('y↑→x')
Reading a File
The example file contains one direction per row. Its first numeric column is the polar angle, and its second is the azimuth, both in degrees. It is one of the sample data files, fetched on first use.
fname = mtexdatafile('vectors')
v = vector3d.load(fname, columnNames=['polar angle', 'azimuth angle'])
v
vector3d (y↑→x)
  size: 1000
        x       y       z
    0.174   0.984  0.0454
  0.00906   0.822   0.569
     0.43   0.901  0.0587
   -0.447  0.0187   0.894
    -0.14   0.556    0.82
        ⋮       ⋮       ⋮
    0.418   0.738    0.53
    0.205   0.196   0.959
   -0.323   0.268   0.908
   -0.249  -0.274   0.929
    0.146   0.982   0.116
The displayed summary identifies a vector3d array of size 1000. Thus all 1000 numeric
rows became directions.
The file happens to use the same words in its heading. Nevertheless, columnNames is an
explicit mapping supplied by the script. It does not ask MTEX to trust or guess the
heading.
Coordinate Names and Angle Units
The importer recognizes these coordinate sets.
Names in columnNames |
Interpretation |
|---|---|
x, y, z |
Cartesian components; their lengths are preserved |
polar, azimuth |
spherical angles |
polar angle, azimuth angle |
spherical angles |
colatitude, longitude |
spherical angles |
latitude, longitude |
geographic angles |
The polar angle is measured away from +Z. The azimuth turns in the XY plane from +X towards +Y. Latitude is instead measured from the XY plane towards +Z, so it is not another name for the polar angle.
Spherical and geographic angles are read in degrees by default. Add the flag
radians=True when the file stores radians. These imports create unit directions, while
Cartesian import preserves the supplied lengths.
Selecting Columns by Position
columns maps each supplied name to a physical column, counted from zero. The next call
deliberately lists the names in reverse order: azimuth is column 1 and polar angle is
column 0.
vByColumn = vector3d.load(fname, columnNames=['azimuth angle', 'polar angle'], columns=[1, 0])
The result contains the same directions as v. This form can also select coordinate
columns from a wider table. Unrelated columns do not take part in constructing the
directions.
Named columns that belong to each direction are returned alongside the directions by
loadVector3d, see Export.
Spherical Approximation and Interpolation starts
from a file with three coordinates and one value.
What the File Does Not Define
A reference frame is the coordinate system in which data are expressed. It has an identity, a basis and a default plotting convention. Numeric columns do not identify a measurement, rolling or geological frame.
The imported vector3d is therefore frame-free. It is not tied to a named reference
frame and resolves against the session default when rendered. Record the source frame
before combining these directions with framed data.
Axes Alignment develops reference frames and frame changes.
The file also does not say whether opposite signs are distinct. MTEX reads the rows as directions. For unoriented axes, read Axes and Antipodal Symmetry before calculating angles, means or densities.
Looking at the Result
A scatter plot shows every imported observation.
scatter(v, upper=True)
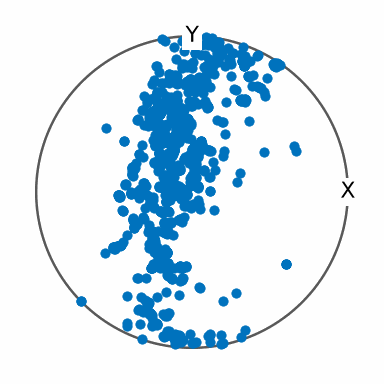
The directions form a narrow, branched band that passes to the left of Z, with smaller
isolated clusters near the rim. All directions in this file lie on the upper hemisphere,
so upper omits none of them. The option is only a hemisphere filter; it does not
identify opposite directions.
A filled contour plot replaces the individual markers with a smoothed estimate of their concentration.
contourf(v, upper=True)
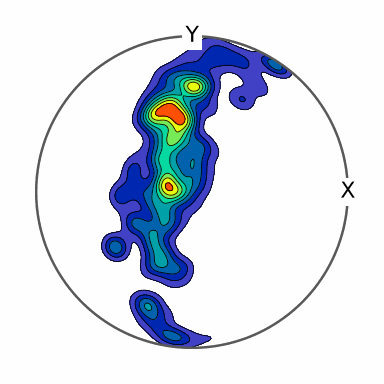
The contour plot separates several maxima within the band. The strongest concentration lies above and left of Z, while the isolated groups remain weaker peaks. These contours are an estimate, not additional measurements, and their shape depends on the smoothing choice.
Spherical Projections explains how the sphere is mapped into these plots. Density Estimation develops the smoothing model and its parameters.
Further Reading
- N. I. Fisher, T. Lewis and B. J. J. Embleton, Statistical Analysis of Spherical Data, Cambridge University Press, 1987. Chapter 2 defines common spherical coordinate systems and distinguishes directed from undirected data.
- ISO 80000-2:2019, Quantities and units - Part 2: Mathematics. This standard defines mathematical symbols and notation for vectors and coordinates.
Next
Write directions back to a text file with Export. Turn a long list of observations into a function on the sphere with Density Estimation. Directions attached to a crystal lattice carry crystal symmetry and are represented by Miller indices.
Domain-specific measurements need more information than a vector table. Continue with EBSD Import or Pole Figure Import for those workflows.
Citing this page.
This page is part of the documentation of
MTEX, a free and open
source MATLAB toolbox for analyzing and modeling crystallographic textures.
It was written by The MTEX Developers and is published at
https://mtex-toolbox.github.io/VectorsImport_py.html.
If you use MTEX, or reuse text or figures from this page, in your research,
please cite
F. Bachmann, R. Hielscher, H. Schaeben: Texture Analysis with MTEX - Free and Open Source Software Toolbox, Solid State Phenomena 160 (2010), 63-68. 10.4028/www.scientific.net/SSP.160.63
BibTeX
@article{bachmann2010mtex,
  author  = {F. Bachmann and R. Hielscher and H. Schaeben},
  title   = {Texture Analysis with MTEX - Free and Open Source Software Toolbox},
  journal = {Solid State Phenomena},
  volume  = {160},
  pages   = {63-68},
  year    = {2010},
  doi     = {10.4028/www.scientific.net/SSP.160.63},
  url     = {https://doi.org/10.4028/www.scientific.net/SSP.160.63}
}
Other papers describing specific MTEX methods are listed under Publications — please cite the one that best fits your application. The MTEX source code is licensed under the GNU General Public License v2.0; the text and figures of this documentation are licensed under CC BY 4.0, which permits reuse — including by automated systems — provided The MTEX Developers and this page are credited.