
the elastic stiffness C, sigma = C : eps; a 6 x 6 Voigt matrix in GPa or the full array
Syntax
stiffnessTensor(M, *args, **kwargs)
Input
M |
6-by-6 Voigt matrix, full (…, 3, 3, 3, 3) coefficients, or another tensor |
args |
optional reference frame |
kwargs |
tensor constructor options, including density, frame, unit and Kelvin; unit defaults to ‘GPa’ |
Example
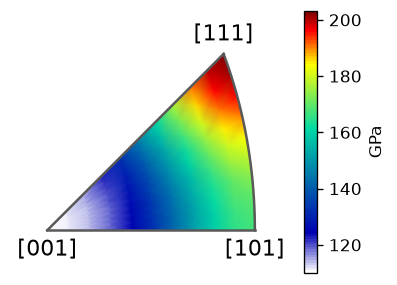
Construct an illustrative cubic stiffness tensor in GPa, rotate it into specimen coordinates, and compare Young’s modulus along the same physical direction before and after rotation.
import numpy as np
import matplotlib.pyplot as plt
from mtex import (crystalFrame, stiffnessTensor, orientation, Miller, degree,
                  plot, mtexColorbar)

cs = crystalFrame('m-3m')
C = stiffnessTensor([[200, 120, 120, 0, 0, 0],
                     [120, 200, 120, 0, 0, 0],
                     [120, 120, 200, 0, 0, 0],
                     [0, 0, 0, 80, 0, 0],
                     [0, 0, 0, 0, 80, 0],
                     [0, 0, 0, 0, 0, 80]], cs, unit='GPa')
direction = Miller(1, 0, 0, cs, 'uvw')
ori = orientation.byEuler(30*degree, 40*degree, 20*degree, cs)
rotated = ori * C
print('Crystal direction modulus (GPa):', round(float(C.YoungsModulus(direction)), 3))
print('Rotated direction modulus (GPa):', round(float(rotated.YoungsModulus(ori*direction)), 3))
plot(C.YoungsModulus(), resolution=5*degree)
mtexColorbar(title='GPa')
plt.show()
The two numerical values agree because tensor and direction were rotated together. The plot shows the directional variation for these model coefficients, not measured material data.
Crystal direction modulus (GPa): 110.0
Rotated direction modulus (GPa): 110.0
Used on
DefinitionAsCoordinateTransform, CPOSeismicProperties, IsotropicTheory, TensorAverage, TensorDefinition
MATLAB’s stiffnessTensor.stiffnessTensor
source
Citing this page.
This page is part of the documentation of
MTEX, a free and open
source MATLAB toolbox for analyzing and modeling crystallographic textures.
It was written by The MTEX Developers and is published at
https://mtex-toolbox.github.io/stiffnessTensor.stiffnessTensor_py.html.
If you use MTEX, or reuse text or figures from this page, in your research,
please cite
F. Bachmann, R. Hielscher, H. Schaeben: Texture Analysis with MTEX - Free and Open Source Software Toolbox, Solid State Phenomena 160 (2010), 63-68. 10.4028/www.scientific.net/SSP.160.63
BibTeX
@article{bachmann2010mtex,
  author  = {F. Bachmann and R. Hielscher and H. Schaeben},
  title   = {Texture Analysis with MTEX - Free and Open Source Software Toolbox},
  journal = {Solid State Phenomena},
  volume  = {160},
  pages   = {63-68},
  year    = {2010},
  doi     = {10.4028/www.scientific.net/SSP.160.63},
  url     = {https://doi.org/10.4028/www.scientific.net/SSP.160.63}
}
Other papers describing specific MTEX methods are listed under Publications — please cite the one that best fits your application. The MTEX source code is licensed under the GNU General Public License v2.0; the text and figures of this documentation are licensed under CC BY 4.0, which permits reuse — including by automated systems — provided The MTEX Developers and this page are credited.