
fill missing measurements in a map using nearby data or grain information.
Syntax
filled = fill(ebsd)
Description
For an MTEX object, fill(x, …) calls x.fill(…). Additional positional and keyword arguments are passed to that method unchanged. Its documentation specifies the accepted inputs, units, symmetry handling and optional outputs. Consult the corresponding method for the behaviour of a particular object type.
Example
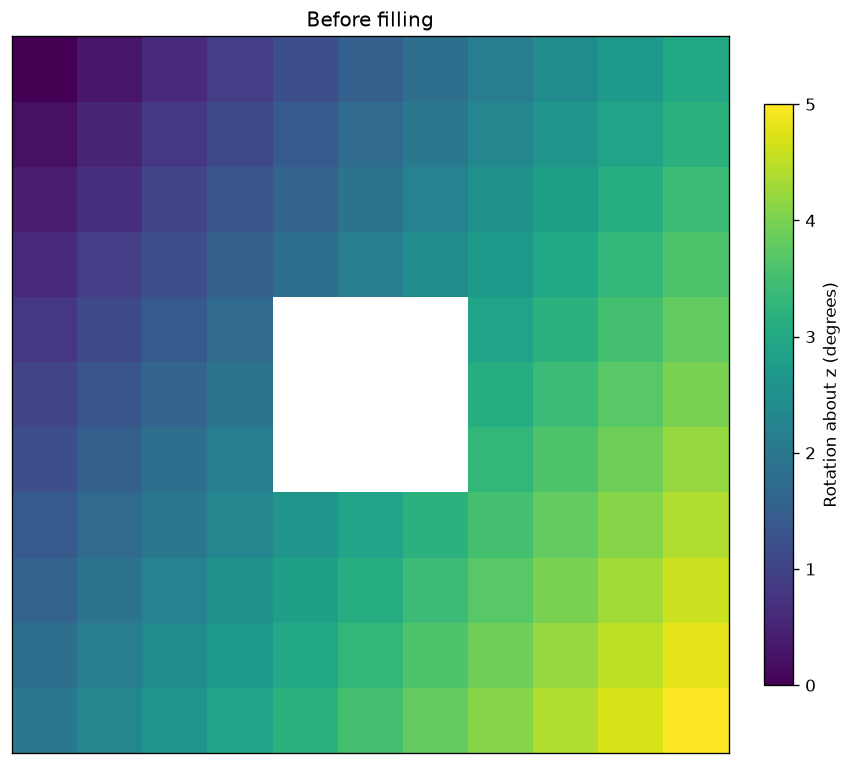
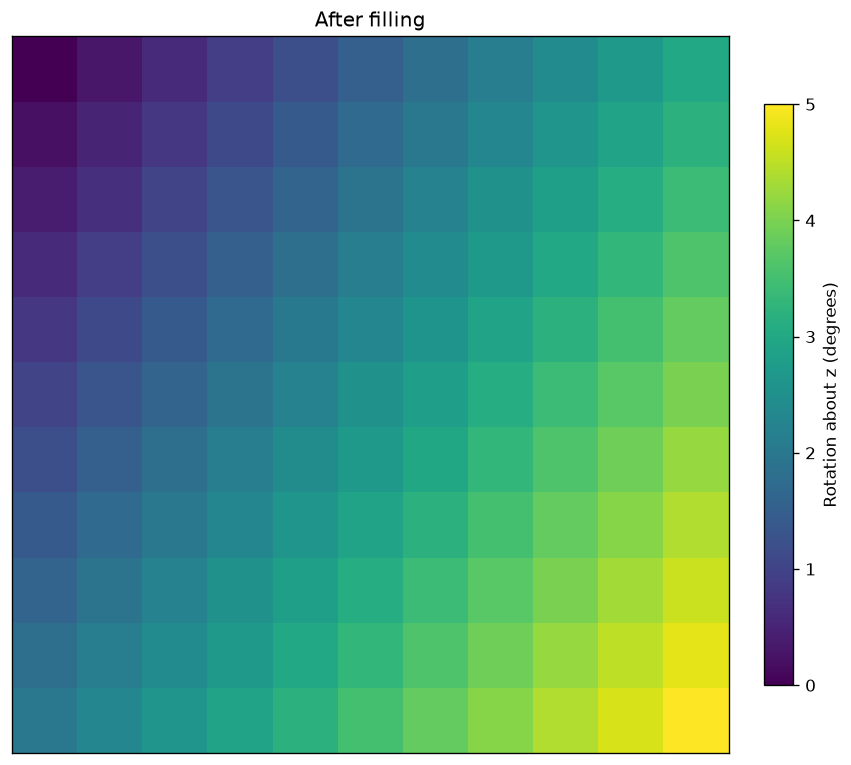
Fill a three-by-three hole in a synthetic orientation gradient. The missing cells exist on the grid and have phase zero and NaN rotations; no data file is needed.
import numpy as np
import matplotlib.pyplot as plt
from mtex import (EBSD, crystalFrame, phaseList, rotation, vector3d, degree,
                  gridify, fill, plot, mtexColorbar, mtexTitle, newMtexFigure)

x, y = np.meshgrid(np.arange(11), np.arange(11))
rot = rotation.byAxisAngle(vector3d.Z, (0.3*x + 0.2*y).ravel()*degree)
hole = ((x >= 4) & (x <= 6) & (y >= 4) & (y <= 6)).ravel()
rot.data[hole] = np.nan
phase = np.where(hole, 0, 1)
ebsd = gridify(EBSD(np.c_[x.ravel(), y.ravel()], rot, phase, phaseList(crystalFrame('m-3m'))))
filled = fill(ebsd)
print('Indexed cells before and after:', np.count_nonzero(ebsd.isIndexed), np.count_nonzero(filled.isIndexed))
measured = ebsd.isIndexed
change = filled.rotations[measured].angle(ebsd.rotations[measured])/degree
print('Largest change at measured cells (degrees):', round(float(np.max(change)), 6))
for data, title in ((ebsd, 'Before filling'), (filled, 'After filling')):
    newMtexFigure()
    plot(data, data.rotations.angle()/degree, colorRange=(0, 5), micronbar=False)
    mtexColorbar(title='Rotation about z (degrees)')
    mtexTitle(title)
plt.show()
Only missing orientations are solved for; the measured orientations stay fixed. The default uses a variational continuation, whereas MATLAB fill uses nearest neighbours. A gap connected to the outer edge remains empty unless extrapolate=True is requested.
Indexed cells before and after: 112 121
Largest change at measured cells (degrees): 0.0
Signature
fill(x, *args, **kwargs)
Methods it calls
| EBSD | the map with every pixel that carries no measurement filled, the measured ones left as they are |
| EBSD3 | the empty voxels of a volume filled from their nearest measured voxel |
Used on
source
Citing this page.
This page is part of the documentation of
MTEX, a free and open
source MATLAB toolbox for analyzing and modeling crystallographic textures.
It was written by The MTEX Developers and is published at
https://mtex-toolbox.github.io/fill_py.html.
If you use MTEX, or reuse text or figures from this page, in your research,
please cite
F. Bachmann, R. Hielscher, H. Schaeben: Texture Analysis with MTEX - Free and Open Source Software Toolbox, Solid State Phenomena 160 (2010), 63-68. 10.4028/www.scientific.net/SSP.160.63
BibTeX
@article{bachmann2010mtex,
  author  = {F. Bachmann and R. Hielscher and H. Schaeben},
  title   = {Texture Analysis with MTEX - Free and Open Source Software Toolbox},
  journal = {Solid State Phenomena},
  volume  = {160},
  pages   = {63-68},
  year    = {2010},
  doi     = {10.4028/www.scientific.net/SSP.160.63},
  url     = {https://doi.org/10.4028/www.scientific.net/SSP.160.63}
}
Other papers describing specific MTEX methods are listed under Publications — please cite the one that best fits your application. The MTEX source code is licensed under the GNU General Public License v2.0; the text and figures of this documentation are licensed under CC BY 4.0, which permits reuse — including by automated systems — provided The MTEX Developers and this page are credited.