
A method of EBSD.
the map with every pixel that carries no measurement filled, the measured ones left as they are
Syntax
ebsd_f = fill(ebsd)
The holes filled.
ebsd_f = fill(ebsd, grains)
Filled within the grains only.
ebsd_f = fill(ebsd, halfQuadraticFilter(), extrapolate=True)
Another filter, up to the outer boundary.
Description
A hole is filled with the smooth continuation of the orientations around it, by a variational filter, l1TVFilter by default; a window filter is refused. Nothing is filled across a grain boundary, where the map has grain ids, or a phase boundary. MATLAB fills by the nearest neighbour instead.
The numeric properties are filled by the same solve, the labels (phase, grain id, …) copied from the nearest measured pixel. A pixel the outside reaches without crossing a measurement stays empty, unless extrapolate=True. Only pixels on the lattice are filled: a gridded map, or the padding gridify adds.
With grains, MATLAB’s fill(ebsd, grains), a pixel is filled only from the grain whose polygon holds it, which needs the grain ids calcGrains writes into the map:
- a pixel inside no grain becomes notIndexed
- a pixel its grain’s measurements do not reach over the lattice takes the grain’s mean orientation
- padding a polygon holds becomes a cell of the map
A pixel counts as measured when it is indexed and has an orientation: the notIndexed pixels calcGrains absorbs into a grain, which carry its phase and a NaN orientation, are filled from within that grain. The map passed is not changed.
Input
ebsd |
EBSD, the map |
F |
EBSDFilter, a variational filter, or grain2d in place of grains |
Keywords
| keyword | default | description |
|---|---|---|
grains |
None |
grain2d of the map: fill a pixel only from the grain whose polygon holds it |
extrapolate |
False |
fill up to the outer boundary of the map |
Output
ebsd_f |
EBSD, the filled map |
Example
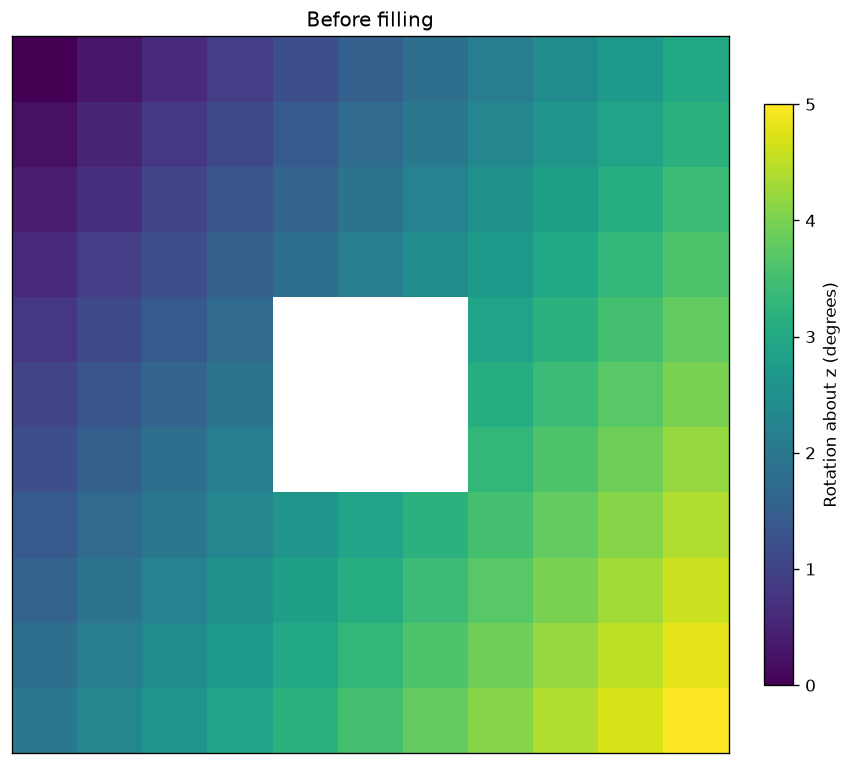
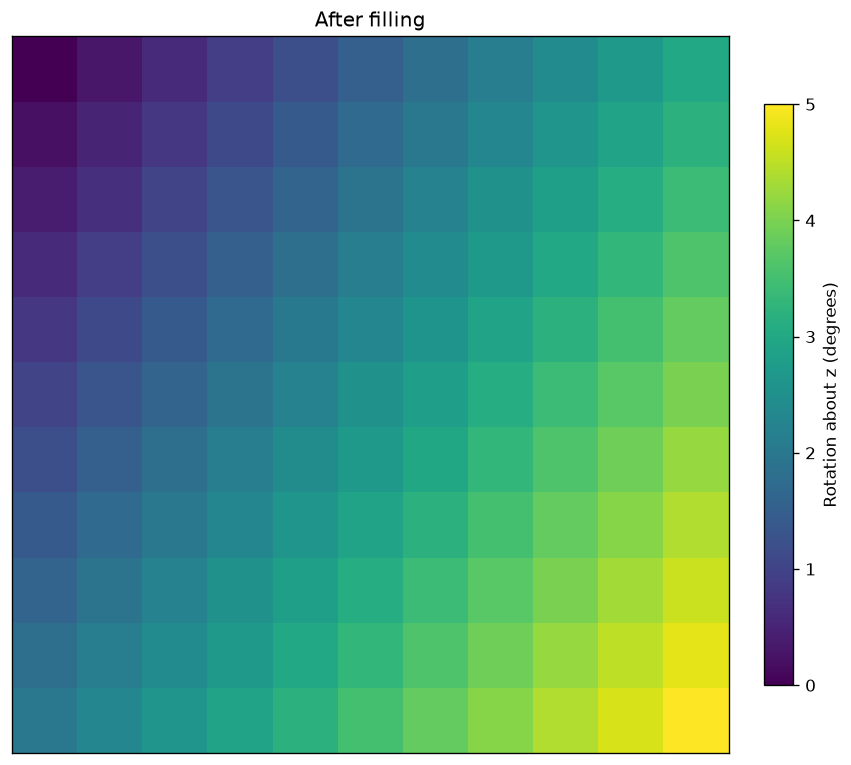
Fill a three-by-three hole in a synthetic orientation gradient. The missing cells exist on the grid and have phase zero and NaN rotations; no data file is needed.
import numpy as np
import matplotlib.pyplot as plt
from mtex import (EBSD, crystalFrame, phaseList, rotation, vector3d, degree,
                  gridify, fill, plot, mtexColorbar, mtexTitle, newMtexFigure)

x, y = np.meshgrid(np.arange(11), np.arange(11))
rot = rotation.byAxisAngle(vector3d.Z, (0.3*x + 0.2*y).ravel()*degree)
hole = ((x >= 4) & (x <= 6) & (y >= 4) & (y <= 6)).ravel()
rot.data[hole] = np.nan
phase = np.where(hole, 0, 1)
ebsd = gridify(EBSD(np.c_[x.ravel(), y.ravel()], rot, phase, phaseList(crystalFrame('m-3m'))))
filled = fill(ebsd)
print('Indexed cells before and after:', np.count_nonzero(ebsd.isIndexed), np.count_nonzero(filled.isIndexed))
measured = ebsd.isIndexed
change = filled.rotations[measured].angle(ebsd.rotations[measured])/degree
print('Largest change at measured cells (degrees):', round(float(np.max(change)), 6))
for data, title in ((ebsd, 'Before filling'), (filled, 'After filling')):
    newMtexFigure()
    plot(data, data.rotations.angle()/degree, colorRange=(0, 5), micronbar=False)
    mtexColorbar(title='Rotation about z (degrees)')
    mtexTitle(title)
plt.show()
Only missing orientations are solved for; the measured orientations stay fixed. The default uses a variational continuation, whereas MATLAB fill uses nearest neighbours. A gap connected to the outer edge remains empty unless extrapolate=True is requested.
Indexed cells before and after: 112 121
Largest change at measured cells (degrees): 0.0
See also
smooth, interp, gridify, calcGrains, EBSDFilling
MATLAB’s EBSD.fill
source
Citing this page.
This page is part of the documentation of
MTEX, a free and open
source MATLAB toolbox for analyzing and modeling crystallographic textures.
It was written by The MTEX Developers and is published at
https://mtex-toolbox.github.io/EBSD.fill_py.html.
If you use MTEX, or reuse text or figures from this page, in your research,
please cite
F. Bachmann, R. Hielscher, H. Schaeben: Texture Analysis with MTEX - Free and Open Source Software Toolbox, Solid State Phenomena 160 (2010), 63-68. 10.4028/www.scientific.net/SSP.160.63
BibTeX
@article{bachmann2010mtex,
  author  = {F. Bachmann and R. Hielscher and H. Schaeben},
  title   = {Texture Analysis with MTEX - Free and Open Source Software Toolbox},
  journal = {Solid State Phenomena},
  volume  = {160},
  pages   = {63-68},
  year    = {2010},
  doi     = {10.4028/www.scientific.net/SSP.160.63},
  url     = {https://doi.org/10.4028/www.scientific.net/SSP.160.63}
}
Other papers describing specific MTEX methods are listed under Publications — please cite the one that best fits your application. The MTEX source code is licensed under the GNU General Public License v2.0; the text and figures of this documentation are licensed under CC BY 4.0, which permits reuse — including by automated systems — provided The MTEX Developers and this page are credited.