
A method of crystalShape.
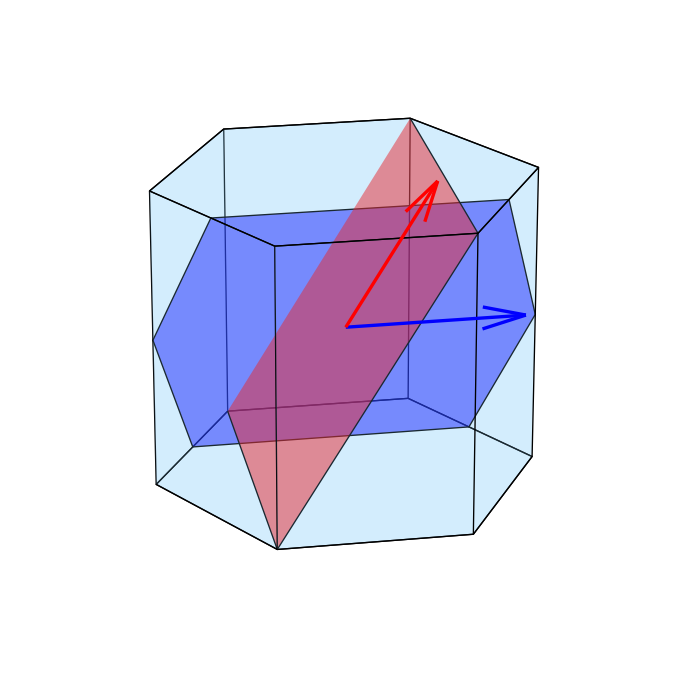
a slip system drawn inside a crystal shape: the slip plane through the centre with the slip direction as an arrow in it
Syntax
plot(cS, sS)
The slip plane and direction, red.
plot(cS, sS, faceColor='blue')
Another colour.
plotSlipSystem(cS, sS, label='b')
The arrow named at its tip.
Description
The plane is the section by the slip plane, as plotInnerFace draws it, the arrow the slip direction from the centre to the surface; several systems are drawn together. Draw the shape translucent first, plot(cS, faceAlpha=0.2), and hold the figure.
Input
cS |
crystalShape |
sS |
slipSystem |
Keywords
| keyword | default | description |
|---|---|---|
faceColor |
'red' |
the colour of the plane and the arrow |
faceAlpha |
0.5 |
the opacity of the plane |
edgeColor |
'k' |
the colour of the edges of the plane |
lineWidth |
0.8 |
the width of the edges of the plane |
displayName |
None |
the label of the plane in a legend |
label |
None |
the text at the tip of the arrow (not on a map) |
Output
h |
the matplotlib collection of the slip planes |
Example
Draw two pyramidal slip systems in a translucent magnesium crystal. The blue plane and arrow show an a-type system; the red ones show a c+a-type system. The lattice parameters are those of Mg-Magnesium.cif in the MATLAB example, in angstroms.
from mtex import crystalFrame, crystalShape, slipSystem, plot, hold
from matplotlib.pyplot import show

cs = crystalFrame('6/mmm', [3.20927, 3.20927, 5.21033], mineral='Magnesium')
cS = crystalShape.hex(cs)
aSlip = slipSystem.pyramidalA(cs)
caSlip = slipSystem.pyramidal2CA(cs)

plot(cS, faceAlpha=0.2)
hold(True)
plot(cS, aSlip, faceColor='blue')
plot(cS, caSlip, faceColor='red')
hold(False)
show()
Keep the first plot with hold(True) so that the slip planes and arrows are added to the same figure.
See also
crystalShape.plotInnerFace, crystalShape.plotInnerDirection, slipSystem, crystalShape.plot, CrystalShapes
MATLAB’s crystalShape.plotSlipSystem
source
Citing this page.
This page is part of the documentation of
MTEX, a free and open
source MATLAB toolbox for analyzing and modeling crystallographic textures.
It was written by The MTEX Developers and is published at
https://mtex-toolbox.github.io/crystalShape.plotSlipSystem_py.html.
If you use MTEX, or reuse text or figures from this page, in your research,
please cite
F. Bachmann, R. Hielscher, H. Schaeben: Texture Analysis with MTEX - Free and Open Source Software Toolbox, Solid State Phenomena 160 (2010), 63-68. 10.4028/www.scientific.net/SSP.160.63
BibTeX
@article{bachmann2010mtex,
  author  = {F. Bachmann and R. Hielscher and H. Schaeben},
  title   = {Texture Analysis with MTEX - Free and Open Source Software Toolbox},
  journal = {Solid State Phenomena},
  volume  = {160},
  pages   = {63-68},
  year    = {2010},
  doi     = {10.4028/www.scientific.net/SSP.160.63},
  url     = {https://doi.org/10.4028/www.scientific.net/SSP.160.63}
}
Other papers describing specific MTEX methods are listed under Publications — please cite the one that best fits your application. The MTEX source code is licensed under the GNU General Public License v2.0; the text and figures of this documentation are licensed under CC BY 4.0, which permits reuse — including by automated systems — provided The MTEX Developers and this page are credited.