
an ODF reconstructed from pole figure intensities by the modified least squares method, with ghost correction and, on request, the zero range method
Syntax
odf = calcODF(pf)
The defaults.
odf = calcODF(pf, halfwidth=7.5*degree, resolution=5*degree)
The halfwidth and the grid.
odf = calcODF(pf, psi)
The ansatz functions of the kernel psi.
odf = calcODF(pf, zeroRange=True)
Drop the orientations the data says are empty.
odf = calcODF(pf, ghostCorrection=False)
Keep the uniform portion in the components.
odf = calcODF(pf, solver)
Run an MLSSolver set up before.
Description
The ODF is a weighted sum of many unimodal ODFs on a grid, whose pole figures are fitted to the intensities in the least squares sense, every pole figure scaled by its own factor. The ghost correction fixes the uniform portion the data allows before the fit; the zero range method removes the components where the measured intensities vanish. MATLAB’s second output, the scaling factors alpha, comes from an MLSSolver, solver.alpha after solver.calcODF(). A kernel or a grid of orientations may be passed positionally.
Input
pf |
PoleFigure |
psi |
SO3Kernel, the shape of the ansatz functions |
solver |
MLSSolver, run with its own settings |
Keywords
| keyword | default | description |
|---|---|---|
resolution |
None |
the spacing of the grid the ansatz functions sit on, by default the resolution of the pole figures (MATLAB: 3/2 of it) |
halfwidth |
None |
the halfwidth of the ansatz functions, by default the resolution of the grid (MATLAB: 2/3 of it) |
kernel |
None |
SO3Kernel, the shape of the ansatz functions instead of the de la Vallee Poussin kernel of the halfwidth |
S3G |
None |
orientation, the centres of the ansatz functions instead of the equispaced grid |
zeroRange |
False |
apply the zero range method: drop the centres where some pole figure says the ODF vanishes; a zeroRangeMethod gives its parameters |
minIter |
5 |
the least number of iterations |
maxIter |
10 |
the largest number of iterations (MATLAB iterMax) |
c0 |
None |
the coefficients of the ansatz functions the iteration starts from, by default all equal |
ghostCorrection |
True |
fix the uniform portion the data allows and reconstruct only the rest; MATLAB flag noGhostCorrection is ghostCorrection=False |
quadratureWeights |
False |
weight the residuals with the quadrature weights of the measured directions (no specimen symmetry) |
intensityWeights |
False |
weight the residuals with (1 + I)^(-1/2), the counting statistics of the intensities I |
regularisation |
0.0 |
the weight of a penalty on the Dirichlet energy, a discrete Laplacian on the grid; zero for none |
verbose |
False |
report the fit of every pole figure in every iteration |
Output
odf |
SO3FunRBF |
Example
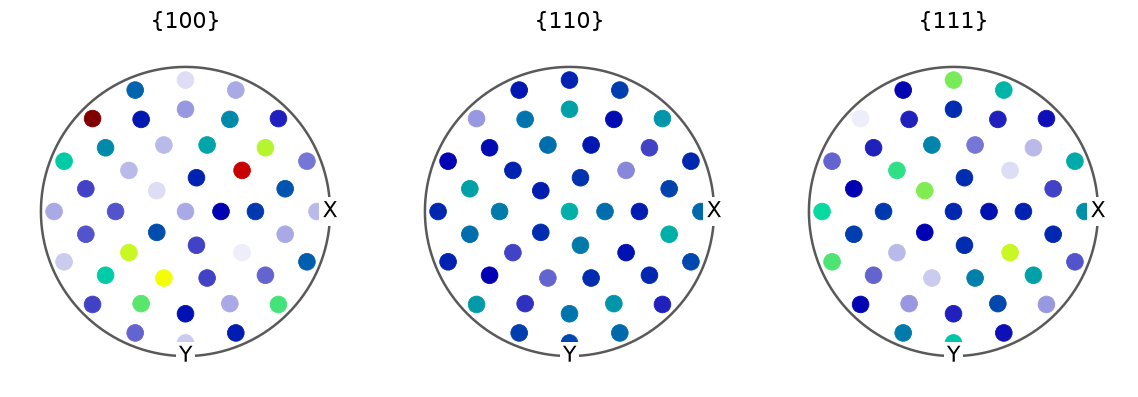
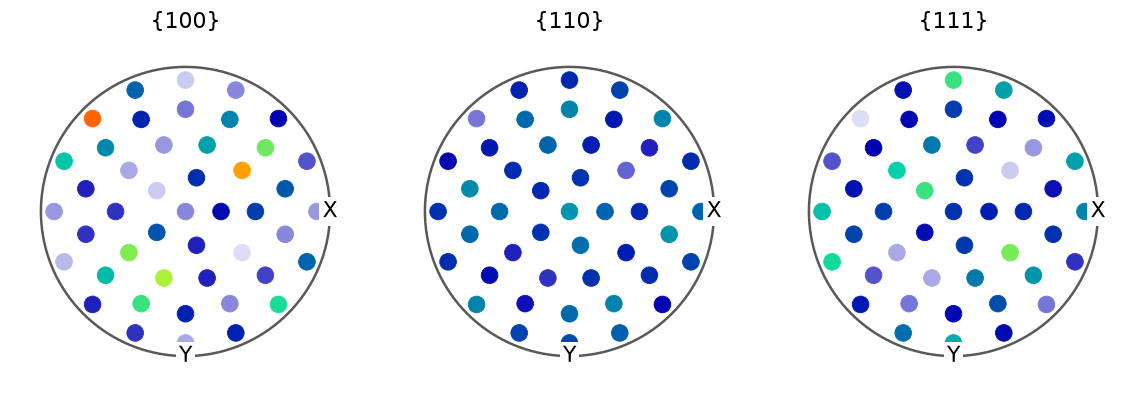
Reconstruct a model ODF from three simulated pole figures, then compare the input and reconstructed intensities. The sampling grid is deliberately coarse, and the fit uses 10-degree orientation spacing.
import numpy as np
import matplotlib.pyplot as plt
from mtex import (crystalFrame, orientation, degree, unimodalODF, Miller,
                  equispacedS2Grid, calcODF, calcError, plotPF)

cs = crystalFrame('m-3m')
centre = orientation.byEuler(35*degree, 45*degree, 10*degree, cs)
model = unimodalODF(centre, halfwidth=20*degree)
h = [Miller(1, 0, 0, cs), Miller(1, 1, 0, cs), Miller(1, 1, 1, cs)]
r = equispacedS2Grid(resolution=20*degree, antipodal=True)
pf = model.calcPoleFigure(h, r)
reconstructed = calcODF(pf, resolution=10*degree, halfwidth=20*degree,
                        minIter=5, maxIter=12, ghostCorrection=False)
fitted = reconstructed.calcPoleFigure(h, r)
print('Relative pole-figure errors:', np.round(calcError(pf, reconstructed), 3))
limit = float(np.max(pf.intensities))
plotPF(pf, colorRange=(0, limit))
plotPF(fitted, colorRange=(0, limit))
plt.show()
The first figure contains the simulated measurements and the second their reconstruction, on the same colour scale. The printed residuals include the coarse-grid approximation. A small pole-figure residual alone does not establish that an ODF is uniquely determined by the data.
Relative pole-figure errors: [0.069 0.052 0.065]
References
- R. Hielscher, H. Schaeben, A novel pole figure inversion method: specification of the MTEX algorithm, J. Appl. Cryst. 41 (2008) 1024-1037
See also
MLSSolver, calcODFIterative, calcError, PoleFigure2ODF, PoleFigure2ODFGhostCorrection, PoleFigureDubna, PoleFigureTutorial
Used on
DetectionOfSampleSymmetry, ODFComponents, SO3FunHarmonicRepresentation, AxesAlignment, CombinedPlots, ContourPlots, PoleFigure2ODF, PoleFigure2ODFAmbiguity, PoleFigure2ODFGhostCorrection, PoleFigureCorrection, PoleFigureDubna, PoleFigureExport
source
Citing this page.
This page is part of the documentation of
MTEX, a free and open
source MATLAB toolbox for analyzing and modeling crystallographic textures.
It was written by The MTEX Developers and is published at
https://mtex-toolbox.github.io/calcODF_py.html.
If you use MTEX, or reuse text or figures from this page, in your research,
please cite
F. Bachmann, R. Hielscher, H. Schaeben: Texture Analysis with MTEX - Free and Open Source Software Toolbox, Solid State Phenomena 160 (2010), 63-68. 10.4028/www.scientific.net/SSP.160.63
BibTeX
@article{bachmann2010mtex,
  author  = {F. Bachmann and R. Hielscher and H. Schaeben},
  title   = {Texture Analysis with MTEX - Free and Open Source Software Toolbox},
  journal = {Solid State Phenomena},
  volume  = {160},
  pages   = {63-68},
  year    = {2010},
  doi     = {10.4028/www.scientific.net/SSP.160.63},
  url     = {https://doi.org/10.4028/www.scientific.net/SSP.160.63}
}
Other papers describing specific MTEX methods are listed under Publications — please cite the one that best fits your application. The MTEX source code is licensed under the GNU General Public License v2.0; the text and figures of this documentation are licensed under CC BY 4.0, which permits reuse — including by automated systems — provided The MTEX Developers and this page are credited.