
A vector-valued spherical function collects several scalar functions on the sphere in one array,
\[f\colon \mathrm{S}^2\to\mathbb{R}^n.\]Its output components are numerical values. This differs from a
spherical vector field, whose output is a geometric vector, and
from a spherical axis field, whose output is unchanged when its
representative is reversed. Use a vector-valued S2Fun when the components should support
array indexing, concatenation and reduction. Component shape is independent of
point-group invariance. Use symmetric spherical functions when all
components share one symmetry.
import numpy as np

from mtex import *

plottingConvention.default('y↑→x')
How component arrays are laid out
MTEX interprets the evaluation nodes as the leading dimensions of the returned values. The dimensions of the spherical-function array follow them.
For example, suppose four nodes \(v_1,\ldots,v_4\) are evaluated by six scalar functions
stored as a \(3\times2\) spherical-function array. The returned array F has shape
\((4, 3, 2)\), with
and
\[F[i, :, 1]=[f_4(v_i),f_5(v_i),f_6(v_i)].\]fourNodes = vector3d.cat(xvector, yvector, zvector, vector3d.byPolar(60 * degree, 45 * degree))
sixValueFunction = lambda v: np.reshape(np.stack([v.x, v.y, v.z, v.x ** 2, v.y ** 2, v.z ** 2], axis=-1),
(v.size, 3, 2), order='F')
F = sixValueFunction(fourNodes)
valueArraySize = F.shape
valueArraySize
(4, 3, 2)
Accordingly, valueArraySize is (4, 3, 2). Index F[i, j, k] is the value at node i
of component (j, k). This rule lets one evaluation retain both the node layout and the
component-array layout.
Interpolate sampled component values
The same convention applies when fitting a harmonic representation. Here the two columns
of sampleValues define two scalar functions at every node.
nodes = equispacedS2Grid(points=800)
nodes = nodes.flatten()
sampleValues = np.stack([S2Fun.smiley(nodes), nodes.x * nodes.y], axis=-1)
interpolate takes the component dimensions after the node
dimension. The resulting sF1 has shape (2,).
sF1 = S2FunHarmonic.interpolate(nodes, sampleValues, bandwidth=12, weights='equal')
componentArraySize = sF1.shape
componentArraySize
(2,)
Plot the components
The scalar plotting commands also accept a vector-valued function. MTEX draws one panel per component rather than combining their values.
plot(sF1, upper=True)
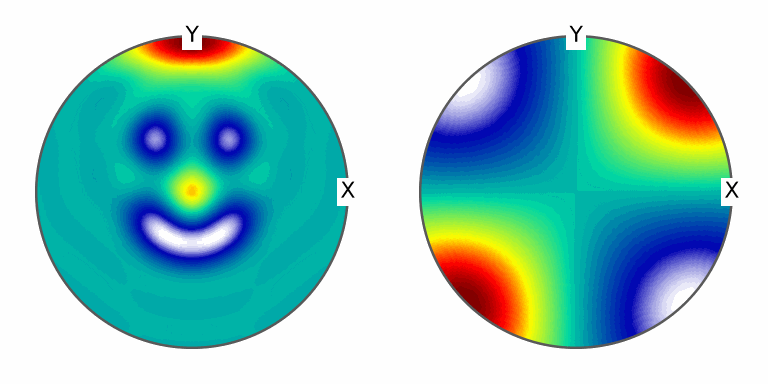
The first panel contains the smiley. The second has four lobes because the sign of \(xy\) alternates between neighboring quadrants. Separate panels are essential here: the two values are components, not the coordinates of arrows.
Construct from a function
A function must return one row per input direction and one column per component. This example retains the original peaked scalar component and appends the Cartesian coordinate functions \(x\), \(y\) and \(z\).
fourComponentFunction = lambda v: np.stack([np.exp(v.x + v.y + v.z) + 50 * (v.y - np.cos(np.pi / 3)) ** 3 * (v.y - np.cos(np.pi / 3) > 0),
                                            v.x, v.y, v.z], axis=-1)
Passing the function to the constructor applies quadrature. The harmonic cutoff is degree
50, and the resulting sF2 has shape (4,).
sF2 = S2FunHarmonic(fourComponentFunction, bandwidth=50)
handleArraySize = sF2.shape
handleArraySize
(4,)
Construct from harmonic coefficients
If the coefficients are already known, pass them directly to the
S2FunHarmonic constructor. The last dimension of
fhat holds the coefficients of one scalar function. Component-array dimensions come
before it.
Thus, if \(\widehat f_1,\ldots,\widehat f_6\) are coefficient rows for the \(3\times2\) example above, their arrangement is
\[\widehat F[:, 0, :]=[\widehat f_1,\widehat f_2,\widehat f_3]\]and
\[\widehat F[:, 1, :]=[\widehat f_4,\widehat f_5,\widehat f_6].\]sF3 = S2FunHarmonic(np.eye(9))
Each row of the identity selects one coefficient. Consequently, sF3 stores the first
nine spherical harmonics as nine component functions. Most applications construct
functions from values and never need to access this coefficient layout directly.
Index, concatenate and reshape components
Component arrays follow ordinary array indexing. Concatenation combines the two functions
in sF1 with the four in sF2, while indexing selects components.
sF4 = S2FunHarmonic.cat(sF1, sF2)
selectedFunctions = sF4[1:3]
Conjugation acts on the coefficients. Transpose and conjugate transpose rearrange the component dimensions.
conjugatedFunctions = conj(sF1)
transposedFunctions = sF1.T
conjugateTransposedFunctions = conj(sF1).T
len and shape inspect the component array rather than the coefficient dimension.
Reshaping the nine functions in sF3 produces a \(3\times3\) spherical-function array.
numberOfFunctions = len(sF1)
shapeOfHandleFunctions = sF2.shape
sF3 = sF3.reshape(3, -1)
Integrate or reduce components
With no axis argument, sum integrates every component over the sphere and mean returns
the spherical mean of every component. Their outputs are numerical arrays with the shape
of sF.
componentIntegrals = sum(sF1)
componentMeans = mean(sF1)
With an axis argument, the same commands perform pointwise array reductions and return another spherical function.
rowSums = sum(sF3, axis=1)
columnMeans = mean(sF3, axis=0)
Pointwise minima and maxima
For a vector-valued function, pass the component axis. The result is the pointwise minimum or maximum along that component axis.
columnMinima = min(sF3, axis=0)
A note on products
A product between two S2FunHarmonic arrays acts pointwise, one function with the
function at the same position.
References
- J. R. Driscoll and D. M. Healy, Computing Fourier transforms and convolutions on the 2-sphere, Advances in Applied Mathematics 15 (1994), 202–250, gives the spherical Fourier framework applied component by component in a vector-valued harmonic function.
Next
Continue with Spherical kernel functions to construct radially symmetric building blocks for spherical functions.
Technical Details
The component axes follow NumPy: indices start at zero, reshape fills rows first, where
MATLAB fills columns, and an axis is named by axis= counted from zero, MATLAB’s
sum(sF3, 2) being sum(sF3, axis=1). The coefficients sit on the last axis of fhat,
where MATLAB has them on the first; a list of \(n\) functions has the shape (n,), where
MATLAB’s is \(n\times 1\). MATLAB’s min(sF3, [], 1) is min(sF3, axis=0), its ' is
conj(sF).T.
Citing this page.
This page is part of the documentation of
MTEX, a free and open
source MATLAB toolbox for analyzing and modeling crystallographic textures.
It was written by The MTEX Developers and is published at
https://mtex-toolbox.github.io/S2FunVectorValued_py.html.
If you use MTEX, or reuse text or figures from this page, in your research,
please cite
F. Bachmann, R. Hielscher, H. Schaeben: Texture Analysis with MTEX - Free and Open Source Software Toolbox, Solid State Phenomena 160 (2010), 63-68. 10.4028/www.scientific.net/SSP.160.63
BibTeX
@article{bachmann2010mtex,
  author  = {F. Bachmann and R. Hielscher and H. Schaeben},
  title   = {Texture Analysis with MTEX - Free and Open Source Software Toolbox},
  journal = {Solid State Phenomena},
  volume  = {160},
  pages   = {63-68},
  year    = {2010},
  doi     = {10.4028/www.scientific.net/SSP.160.63},
  url     = {https://doi.org/10.4028/www.scientific.net/SSP.160.63}
}
Other papers describing specific MTEX methods are listed under Publications — please cite the one that best fits your application. The MTEX source code is licensed under the GNU General Public License v2.0; the text and figures of this documentation are licensed under CC BY 4.0, which permits reuse — including by automated systems — provided The MTEX Developers and this page are credited.