
A method of EBSD.
the average of a property over each grain; MATLAB’s grainMean
Syntax
meanG = grainMean(ebsd, ebsd.ci, grains)
One value per grain.
meanE = grainMean(ebsd, ebsd.ci)
The value of its grain at every pixel.
maxG = grainMean(ebsd, ebsd.ci, grains, np.max)
The maximum instead of the mean.
meanG = grainMean(ebsd, ebsd.ci, grains, llim=0.1)
Only the values above 0.1.
Description
The grains are those of the grain ids the map carries, which calcGrains stores with it. A pixel without a grain and a grain without a value in the range are NaN.
Input
ebsd |
EBSD with grain ids |
prop |
array of a value per pixel, of the shape of the map |
grains |
grain2d, for one value per grain in its order; without it one value per pixel |
method |
the reduction of the values of a grain, a function of an array |
Keywords
| keyword | default | description |
|---|---|---|
ulim |
inf |
the largest value taken into the average |
llim |
-inf |
the smallest value taken into the average |
Output
meanProp |
array, a value per grain, or one per pixel of the shape of the map |
Example
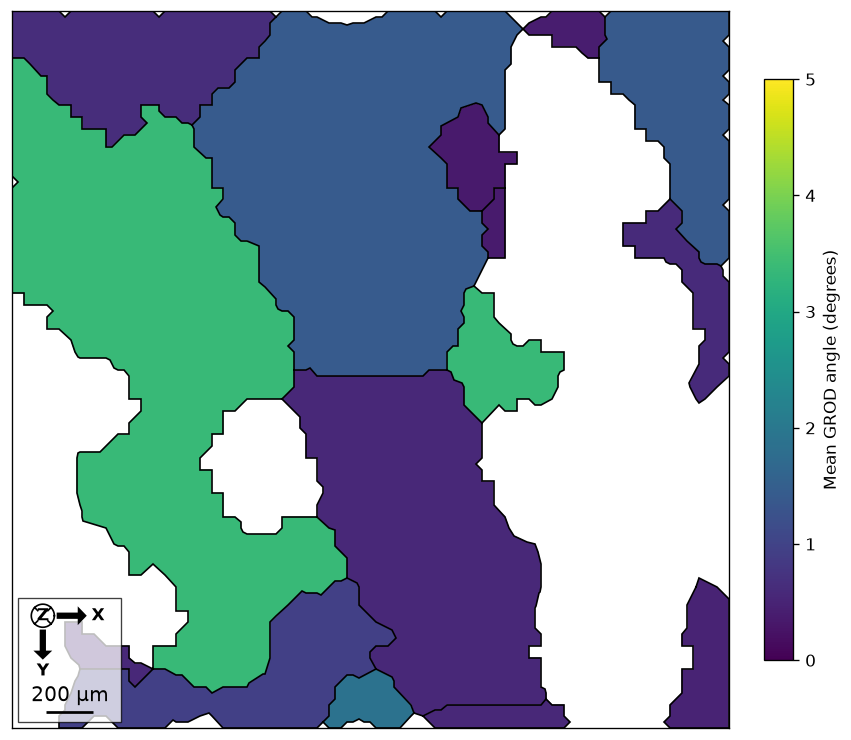
Average the GROD angle once per grain and map the same averages back to the pixels. The small Forsterite sample is downloaded and cached on first use.
import numpy as np
import matplotlib.pyplot as plt
from mtex import mtexdata, calcGrains, calcGROD, grainMean, degree, plot, mtexColorbar

ebsd = mtexdata('small', verbose=False)['Forsterite']
grains = calcGrains(ebsd, angle=10*degree, minPixel=5)
omega = calcGROD(ebsd, grains).angle()/degree
perGrain = grainMean(ebsd, omega, grains)
perPixel = grainMean(ebsd, omega)
print('Per-grain shape:', perGrain.shape, 'Per-pixel shape:', perPixel.shape)
print('First five grain means (degrees):', np.round(perGrain[:5], 3))
plot(grains, perGrain, colorRange=(0, 5))
mtexColorbar(title='Mean GROD angle (degrees)')
plt.show()
With grains supplied, the output follows grains.id; without it, each pixel receives its grain average. Averaging the deviation angle gives an angular spread, not a mean orientation. Use orientation.mean to average orientations with crystal symmetry.
Per-grain shape: (15,) Per-pixel shape: (1952,)
First five grain means (degrees): [0.632 1.407 0.406 1.394 3.378]
See also
calcGrains, calcGROD, grain2d.meanOrientation, GrainOrientationParameters, GrainSpatialPlots
MATLAB’s EBSD.grainMean
source
Citing this page.
This page is part of the documentation of
MTEX, a free and open
source MATLAB toolbox for analyzing and modeling crystallographic textures.
It was written by The MTEX Developers and is published at
https://mtex-toolbox.github.io/EBSD.grainMean_py.html.
If you use MTEX, or reuse text or figures from this page, in your research,
please cite
F. Bachmann, R. Hielscher, H. Schaeben: Texture Analysis with MTEX - Free and Open Source Software Toolbox, Solid State Phenomena 160 (2010), 63-68. 10.4028/www.scientific.net/SSP.160.63
BibTeX
@article{bachmann2010mtex,
  author  = {F. Bachmann and R. Hielscher and H. Schaeben},
  title   = {Texture Analysis with MTEX - Free and Open Source Software Toolbox},
  journal = {Solid State Phenomena},
  volume  = {160},
  pages   = {63-68},
  year    = {2010},
  doi     = {10.4028/www.scientific.net/SSP.160.63},
  url     = {https://doi.org/10.4028/www.scientific.net/SSP.160.63}
}
Other papers describing specific MTEX methods are listed under Publications — please cite the one that best fits your application. The MTEX source code is licensed under the GNU General Public License v2.0; the text and figures of this documentation are licensed under CC BY 4.0, which permits reuse — including by automated systems — provided The MTEX Developers and this page are credited.