
A method of EBSD.
the grain reference orientation deviation, mis2mean: the misorientation of every pixel from the mean orientation of its grain, or from a given reference; MATLAB’s calcGROD
Syntax
grains = calcGrains(ebsd)
The grain ids stored with the map.
GROD = calcGROD(ebsd, grains)
The deviation from the grain mean.
GROD = calcGROD(ebsd, rotRef=oriRef)
The deviation from a reference orientation.
Description
The reference is taken over the symmetric equivalent closest to the pixel, so the deviation is the small rotation it is meant to be; its angle is the GROD angle. A pixel without a grain or not indexed is NaN. The map must hold one phase.
Input
ebsd |
EBSD of one phase, with the grain ids calcGrains stores |
Keywords
| keyword | default | description |
|---|---|---|
grains |
None |
grain2d whose meanRotation is the reference of its pixels |
rotRef |
None |
rotation, the reference of every pixel or of all, instead of the grains |
Output
GROD |
orientation, the misorientation of every pixel, of the shape of the map |
Example
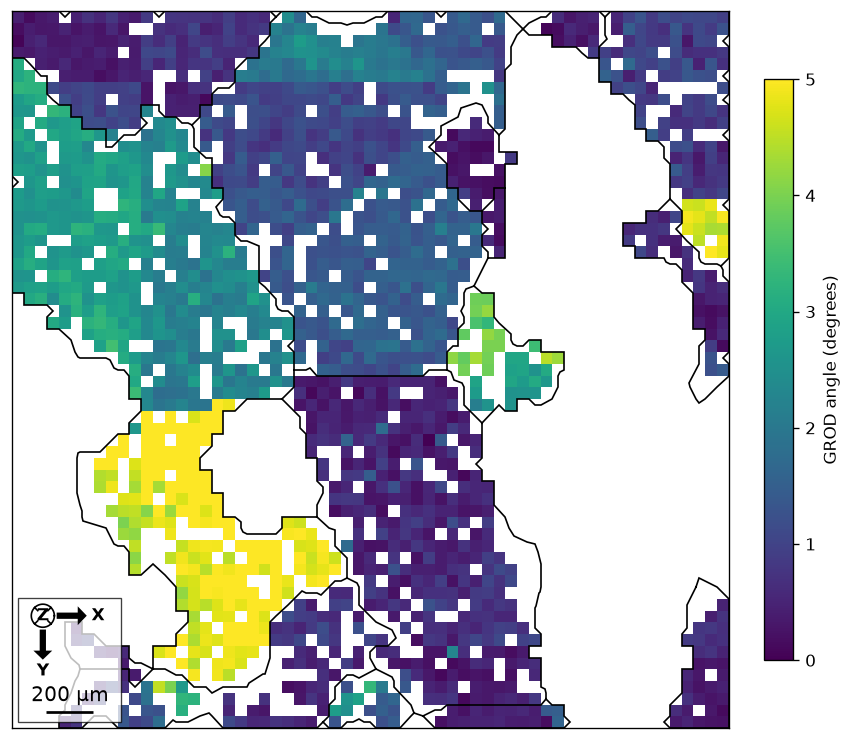
Compare each Forsterite orientation with the mean of its reconstructed grain. The small sample is downloaded and cached on first use.
import numpy as np
import matplotlib.pyplot as plt
from mtex import mtexdata, calcGrains, calcGROD, degree, plot, hold, mtexColorbar

ebsd = mtexdata('small', verbose=False)['Forsterite']
grains = calcGrains(ebsd, angle=10*degree, minPixel=5)
grod = calcGROD(ebsd, grains)
omega = grod.angle()/degree
print('Median deviation from grain mean (degrees):', round(float(np.nanmedian(omega)), 3))
plot(ebsd, omega, colorRange=(0, 5))
mtexColorbar(title='GROD angle (degrees)')
hold(True)
plot(grains.boundary, lineWidth=1)
hold(False)
plt.show()
The result contains misorientations; angle extracts their magnitudes. GROD uses a grain reference, while KAM uses local neighbours. Select one indexed phase before calculating GROD; pixels without a reconstructed grain have no grain reference and give NaN.
Median deviation from grain mean (degrees): 1.266
See also
Used on
MATLAB’s EBSD.calcGROD
source
Citing this page.
This page is part of the documentation of
MTEX, a free and open
source MATLAB toolbox for analyzing and modeling crystallographic textures.
It was written by The MTEX Developers and is published at
https://mtex-toolbox.github.io/EBSD.calcGROD_py.html.
If you use MTEX, or reuse text or figures from this page, in your research,
please cite
F. Bachmann, R. Hielscher, H. Schaeben: Texture Analysis with MTEX - Free and Open Source Software Toolbox, Solid State Phenomena 160 (2010), 63-68. 10.4028/www.scientific.net/SSP.160.63
BibTeX
@article{bachmann2010mtex,
  author  = {F. Bachmann and R. Hielscher and H. Schaeben},
  title   = {Texture Analysis with MTEX - Free and Open Source Software Toolbox},
  journal = {Solid State Phenomena},
  volume  = {160},
  pages   = {63-68},
  year    = {2010},
  doi     = {10.4028/www.scientific.net/SSP.160.63},
  url     = {https://doi.org/10.4028/www.scientific.net/SSP.160.63}
}
Other papers describing specific MTEX methods are listed under Publications — please cite the one that best fits your application. The MTEX source code is licensed under the GNU General Public License v2.0; the text and figures of this documentation are licensed under CC BY 4.0, which permits reuse — including by automated systems — provided The MTEX Developers and this page are credited.