
sample map measurements along a spatial polyline.
Syntax
profile, distance = spatialProfile(ebsd, points)
Description
For an MTEX object, spatialProfile(x, …) calls x.spatialProfile(…). Additional positional and keyword arguments are passed to that method unchanged. Its documentation specifies the accepted inputs, units, symmetry handling and optional outputs. Consult the corresponding method for the behaviour of a particular object type.
Example
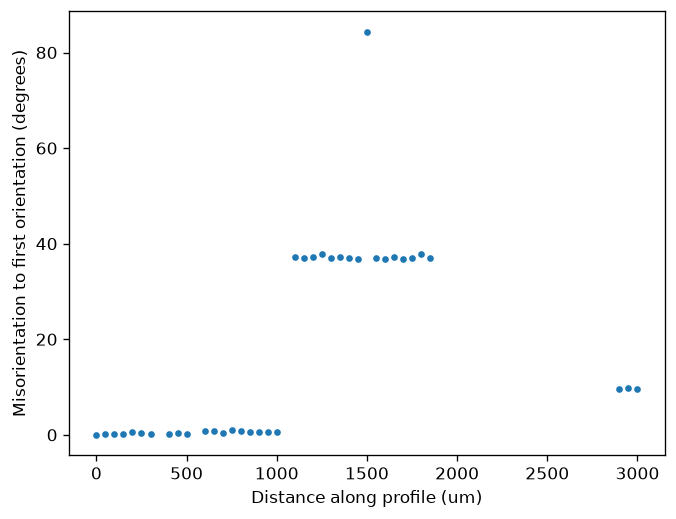
Extract a horizontal profile through the small Forsterite map and plot its misorientation relative to the first selected orientation. The sample is cached after its first download.
import numpy as np
import matplotlib.pyplot as plt
from mtex import mtexdata, spatialProfile, degree

ebsd = mtexdata('small', verbose=False)['Forsterite']
y = float(np.median(ebsd.y))
line = [[float(np.min(ebsd.x)), y], [float(np.max(ebsd.x)), y]]
profile, distance = spatialProfile(ebsd, line)
omega = profile.orientations.angle(profile.orientations[0])/degree
print('Selected measurements:', profile.size)
print('Distance increases:', bool(np.all(np.diff(distance) >= 0)))
plt.plot(distance, omega, '.')
plt.xlabel('Distance along profile (um)')
plt.ylabel('Misorientation to first orientation (degrees)')
plt.show()
Distances use the scan unit and start at the first line endpoint. The default band extends half a lattice step on either side of the line; radius changes that band. Large jumps can mark different grains. This extracts measured pixels rather than interpolating an orientation field.
Selected measurements: 38
Distance increases: True
Signature
spatialProfile(x, *args, **kwargs)
Methods it calls
| EBSD | the measurements along a polyline, in the order they are met, and the distance along the line of each of them |
| EBSD3 | the voxels along a polyline, sampled at the voxel spacing, and their distance along it |
Used on
source
Citing this page.
This page is part of the documentation of
MTEX, a free and open
source MATLAB toolbox for analyzing and modeling crystallographic textures.
It was written by The MTEX Developers and is published at
https://mtex-toolbox.github.io/spatialProfile_py.html.
If you use MTEX, or reuse text or figures from this page, in your research,
please cite
F. Bachmann, R. Hielscher, H. Schaeben: Texture Analysis with MTEX - Free and Open Source Software Toolbox, Solid State Phenomena 160 (2010), 63-68. 10.4028/www.scientific.net/SSP.160.63
BibTeX
@article{bachmann2010mtex,
  author  = {F. Bachmann and R. Hielscher and H. Schaeben},
  title   = {Texture Analysis with MTEX - Free and Open Source Software Toolbox},
  journal = {Solid State Phenomena},
  volume  = {160},
  pages   = {63-68},
  year    = {2010},
  doi     = {10.4028/www.scientific.net/SSP.160.63},
  url     = {https://doi.org/10.4028/www.scientific.net/SSP.160.63}
}
Other papers describing specific MTEX methods are listed under Publications — please cite the one that best fits your application. The MTEX source code is licensed under the GNU General Public License v2.0; the text and figures of this documentation are licensed under CC BY 4.0, which permits reuse — including by automated systems — provided The MTEX Developers and this page are credited.