
Select the angular halfwidth of a de la Vallee Poussin kernel for density estimation.
Syntax
from mtex.functions.halfwidth import degreeEnergies, selectHalfwidth
E = degreeEnergies(v, bandwidth=256)
h = selectHalfwidth(E)
Select from the degree energies of directions.
h = selectHalfwidth(E, method='conservative')
Favour wider kernels when the energies are uncertain.
h = selectHalfwidth(E, noiseFloor=False)
Use the selected method without the noise floor.
Description
The halfwidth controls how much the density estimate is smoothed: narrow kernels retain
finer detail, while wide kernels smooth out more of the sampling noise. It is the angle
at which the kernel falls to half its peak value. The result is in radians; divide by
degree to express it in degrees.
Both methods balance smoothing bias against sampling variance using the harmonic degree energies in E. ‘UCV’ (unbiased cross validation) minimises an unbiased estimate of the integrated squared error. ‘conservative’ uses lower confidence bounds on the energies, favouring wider kernels when fine detail is uncertain. It needs energies computed with folds and finite error estimates in E.se; the default eight folds are suitable.
By default, a noise floor can widen either choice to reduce false peaks caused by
sampling noise. It is the smallest candidate halfwidth whose estimated fluctuations
stay below tau + tauRel * localDensity. Unless tau is supplied, tau is tauMax
times the maximum of a pilot density estimate. This is an approximate noise criterion;
alpha does not give a rigorous confidence guarantee for the entire density estimate.
If no candidate meets it, the widest candidate is used.
UCV considers only candidates whose kernels are resolved by E’s harmonic bandwidth.
Increase the bandwidth when the choice is limited by this resolution; ucvAtEdge
detects that case. An error is raised if no candidate is resolved. The conservative
method treats the density’s energies above E’s bandwidth as zero.
Compute E with degreeEnergies from orientations, directions or an EBSD map. Pass
weights and grain groups there; pixels within one grain must not be counted as
independent observations. To select a kernel directly from a sample, use calcKernel.
Input
E |
degreeEnergies object containing the sample’s harmonic energies and statistics |
Keywords
| keyword | default | description |
|---|---|---|
method |
'UCV' |
‘UCV’ or ‘conservative’, case insensitive |
halfwidths |
None |
candidate halfwidths in radians, in increasing order; by default 60 geometrically spaced values from 1 to 60 degrees for directions, or 2 to 40 degrees for orientations |
noiseFloor |
True |
apply the additional lower bound that limits estimated sampling noise |
z |
2.0 |
number of standard errors subtracted from the energies for ‘conservative’; None uses a Bonferroni normal quantile based on alpha |
alpha |
0.05 |
nominal error probability for the approximate noise bound and, when z=None, the simultaneous lower confidence bounds on the energies |
tau |
None |
absolute noise tolerance in density units, relative to a uniform density of one; None uses tauMax times the pilot maximum |
tauMax |
0.2 |
fraction of the pilot maximum used as the absolute tolerance when tau=None |
tauRel |
0.5 |
additional noise tolerance as a fraction of the local density; increasing either tolerance allows narrower kernels |
Output
h |
selected halfwidth as a float in radians, chosen from the candidates |
Example
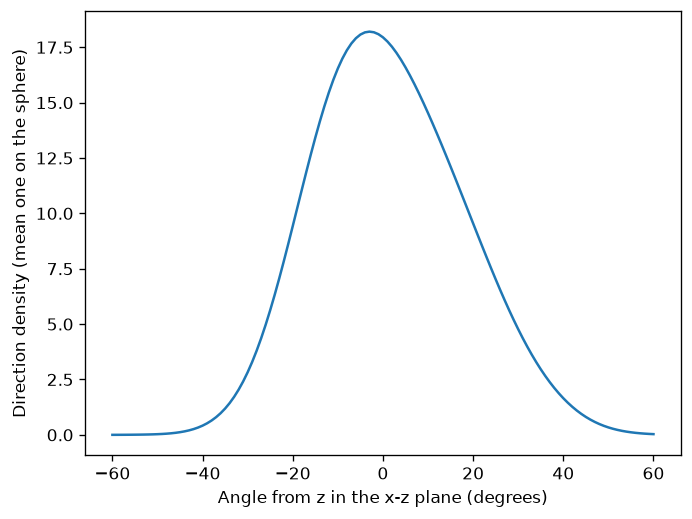
Select a kernel halfwidth for grouped direction measurements and use it in a spherical density estimate. Two measurements per group share a synthetic grain direction.
import numpy as np
import matplotlib.pyplot as plt
from mtex import vector3d, degree, calcDensity
from mtex.functions.halfwidth import degreeEnergies, selectHalfwidth

rng = np.random.default_rng(4)
grainDirections = rng.normal([0, 0, 1], [0.3, 0.3, 0.05], size=(40, 3))
measurements = np.repeat(grainDirections, 2, axis=0) + rng.normal(0, 0.01, size=(80, 3))
v = vector3d(measurements).normalize()
groups = np.repeat(np.arange(40), 2)
energies = degreeEnergies(v, groups=groups, bandwidth=64, folds=8, rng=np.random.default_rng(5))
candidates = np.linspace(5, 40, 36)*degree
halfwidth = selectHalfwidth(energies, halfwidths=candidates, noiseFloor=False)
density = calcDensity(v, halfwidth=halfwidth)
theta = np.linspace(-60, 60, 121)*degree
probe = vector3d(np.sin(theta), np.zeros_like(theta), np.cos(theta))
print('Selected halfwidth (degrees):', round(float(halfwidth/degree), 2))
plt.plot(theta/degree, density(probe))
plt.xlabel('Angle from z in the x-z plane (degrees)')
plt.ylabel('Direction density (mean one on the sphere)')
plt.show()
Group ids make the forty grain groups the independent sampling units for width selection. The noise floor is switched off here to isolate UCV and keep this demonstration short; it is enabled by default. Increase the energy bandwidth when considering narrower kernels.
Selected halfwidth (degrees): 12.0
See also
degreeEnergies, calcKernel, ucvHalfwidth, lowerBoundHalfwidth, noiseFloorHalfwidth, ucvAtEdge
MATLAB’s selectHalfwidth
source
Citing this page.
This page is part of the documentation of
MTEX, a free and open
source MATLAB toolbox for analyzing and modeling crystallographic textures.
It was written by The MTEX Developers and is published at
https://mtex-toolbox.github.io/selectHalfwidth_py.html.
If you use MTEX, or reuse text or figures from this page, in your research,
please cite
F. Bachmann, R. Hielscher, H. Schaeben: Texture Analysis with MTEX - Free and Open Source Software Toolbox, Solid State Phenomena 160 (2010), 63-68. 10.4028/www.scientific.net/SSP.160.63
BibTeX
@article{bachmann2010mtex,
  author  = {F. Bachmann and R. Hielscher and H. Schaeben},
  title   = {Texture Analysis with MTEX - Free and Open Source Software Toolbox},
  journal = {Solid State Phenomena},
  volume  = {160},
  pages   = {63-68},
  year    = {2010},
  doi     = {10.4028/www.scientific.net/SSP.160.63},
  url     = {https://doi.org/10.4028/www.scientific.net/SSP.160.63}
}
Other papers describing specific MTEX methods are listed under Publications — please cite the one that best fits your application. The MTEX source code is licensed under the GNU General Public License v2.0; the text and figures of this documentation are licensed under CC BY 4.0, which permits reuse — including by automated systems — provided The MTEX Developers and this page are credited.