Discretisation of 2 - Sphere (The Class S2Grid)
represents a grid of nodes on the sphere
| On this page ... |
| Class Description |
| Defining a S2Grid |
| Plots |
| Complete Function list |
Class Description
The class S2Grid is used in MTEX to store the set of specimen directions organized in a pole figure. Of central importance is also the plotting method of this class since it is used by almost all other plotting methods in MTEX to perform spherical plots.
Defining a S2Grid
There are various ways to define a S2Grid. Next, you find some examples. For a detailed description of possible specifications look for the documentation of the constructor S2Grid.
% equidistributions
S2G = equispacedS2Grid('points',100,'antipodal');  % specified by number of points
S2G = equispacedS2Grid('RESOLUTION',5*degree,'antipodal');  % specified by resolution

% regular grids
S2G = regularS2Grid('points',[72,19]); % specified by number of theta and rho steps
S2G = regularS2Grid('theta',linspace(0,2*pi,72),...
             'rho',linspace(0,pi/2,19)); % explicitly determine theta and rho values

% restrictes grids
S2G = equispacedS2Grid('points',100,'MAXTHETA',75*degree);  % specify maximum theta angle
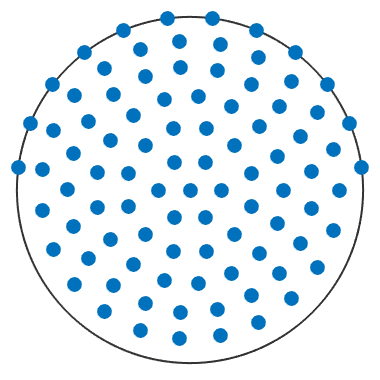
Plots
plot(equispacedS2Grid('points',100,'antipodal')) % plot the grid of nodes
Complete Function list
| Syntax | |
| S2Grid(theta,rho) % fills a Sphere with N | odes |
| regularS2Grid('resolution',5*degree) % construct regular polar and azimuthal spacing | |
| equispacedS2Grid('resolution',5*degree) % construct equispaced nodes | |
| Input | |
| nodes | @vector3d |
| Options | |
| POINTS | [nrho,ntheta] number of points to be generated |
| RESOLUTION | resolution of a equispaced grid |
| HEMISPHERE | 'lower', 'uper', 'complete', 'sphere', 'identified'} |
| THETA | theta angle |
| RHO | rho angle |
| MINRHO | starting rho angle (default 0) |
| MAXRHO | maximum rho angle (default 2*pi) |
| MINTHETA | starting theta angle (default 0) |
| MAXTHETA | maximum theta angle (default pi) |
| Flags | |
| REGULAR | generate a regular grid |
| EQUISPACED | generate equidistribution |
| ANTIPODAL | include antipodal symmetry |
| PLOT | generate plotting grid |
| NO_CENTER | ommit point at center |
| RESTRICT2MINMAX | restrict margins to min / max |
| Examples | |
| regularS2Grid('points',[72 19]) | |
| regularS2Grid('resolution',[5*degree 2.5*degree]) | |
| equispacedS2Grid('resolution',5*degree,'maxrho',pi) | |
| plot(ans) | |
| See also | |
| vector3d/vector3d |
| DocHelp 0.1 beta |