
A method of EBSD.
read an EBSD map from a supported vendor file or a text table
Syntax
ebsd = EBSD.load('map.ang')
ebsd = EBSD.load('map.ctf', grid=False)
Description
This calls loadEBSD with the same arguments. The file format is selected from the extension unless interface is given. Phase information, orientations, positions and available pixel properties are read together; complete scans are returned on their grid by default. For text-table column definitions and import corrections, consult loadEBSD. Use inspectEBSD to inspect file metadata before importing.
Input
fname |
input filename |
args |
positional options accepted by loadEBSD |
kwargs |
keyword options accepted by loadEBSD |
Output
ebsd |
EBSD map |
Example
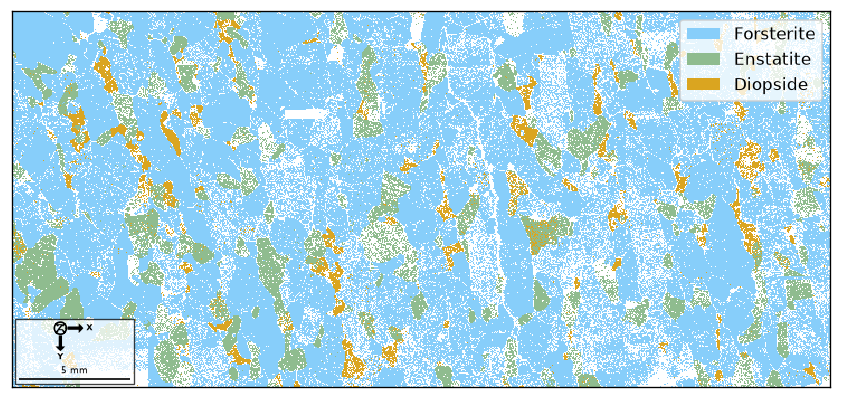
Read the Forsterite vendor file directly and draw its phase map. The sample file is downloaded and cached on first use. The Euler correction shown here is specific to this file.
import matplotlib.pyplot as plt
from mtex import EBSD, mtexdatafile, rotation, vector3d, degree, plot

filename = mtexdatafile('forsterite', verbose=False)
correction = rotation.byAxisAngle(vector3d.X, 180*degree)
ebsd = EBSD.load(filename, eulerCorrection=correction)
print(ebsd)
plot(ebsd, refFrame='on')
plt.show()
Inspect the phase list and the reference-frame indicator after import. For another file, choose the format options and Euler correction from its acquisition convention.
EBSD (y↓→x)
  size: 336 × 732 grid
  Phase  Orientations  Mineral     Color         Symmetry  Crystal reference frame
  0      58485 (24%)   notIndexed
  1      152345 (62%)  Forsterite  LightSkyBlue  mmm       Forsterite
  2      26058 (11%)   Enstatite   DarkSeaGreen  mmm       Enstatite
  3      9064 (3.7%)   Diopside    Goldenrod     12/m1     Diopside
  properties    : bands, bc, bs, error, mad
  scan unit     : um
  X × Y         : [0 → 3.655e+04] × [0 → 1.675e+04]
  square lattice: spacing 50
See also
loadEBSD, inspectEBSD, EBSD.export
Signature
EBSD.load(fname, *args, **kwargs)
MATLAB’s EBSD.load
source
Citing this page.
This page is part of the documentation of
MTEX, a free and open
source MATLAB toolbox for analyzing and modeling crystallographic textures.
It was written by The MTEX Developers and is published at
https://mtex-toolbox.github.io/EBSD.load_py.html.
If you use MTEX, or reuse text or figures from this page, in your research,
please cite
F. Bachmann, R. Hielscher, H. Schaeben: Texture Analysis with MTEX - Free and Open Source Software Toolbox, Solid State Phenomena 160 (2010), 63-68. 10.4028/www.scientific.net/SSP.160.63
BibTeX
@article{bachmann2010mtex,
  author  = {F. Bachmann and R. Hielscher and H. Schaeben},
  title   = {Texture Analysis with MTEX - Free and Open Source Software Toolbox},
  journal = {Solid State Phenomena},
  volume  = {160},
  pages   = {63-68},
  year    = {2010},
  doi     = {10.4028/www.scientific.net/SSP.160.63},
  url     = {https://doi.org/10.4028/www.scientific.net/SSP.160.63}
}
Other papers describing specific MTEX methods are listed under Publications — please cite the one that best fits your application. The MTEX source code is licensed under the GNU General Public License v2.0; the text and figures of this documentation are licensed under CC BY 4.0, which permits reuse — including by automated systems — provided The MTEX Developers and this page are credited.