plotFibre
(method of ODF)
plot odf along a fibre
Syntax
plotFibre(odf,f);
Input
| odf | |||||
| f | |||||
| param,val | Parameters and values that control plotFibre
|
Example
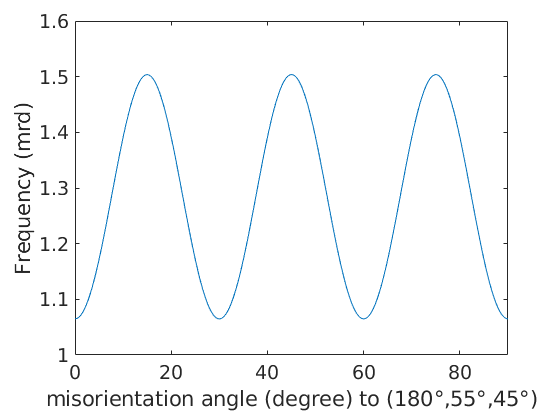
odf = SantaFe;
f = fibre.gamma(odf.CS,odf.SS)
plotFibre(SantaFe,f)
f = fibre
 size: 1 x 1
 crystal symmetry:  m-3m
 specimen symmetry: 222
 o1: (180°,55°,45°)
 o2: (270°,55°,45°)
See also
S2Grid/plot, savefigure, Plotting, Annotations_demo, ColorCoding_demo, PlotTypes_demo, SphericalProjection_demo
| DocHelp 0.1 beta |