plot
(method of EBSD)
spatial EBSD plot
Syntax
% colorize according to phase
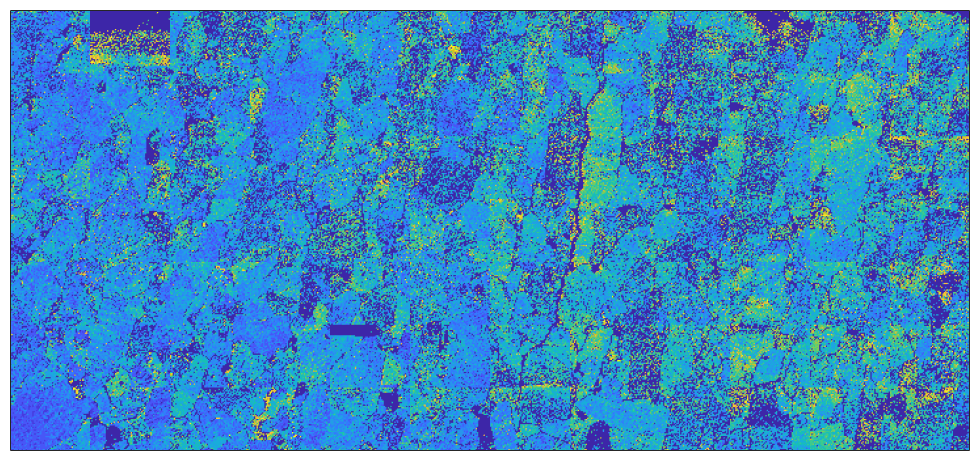
plot(ebsd)% colorize according to arbitrary value - here MAD
plot(ebsd,ebsd.mad)% colorize according to orientation plot(ebsd('phaseName'),ebsd('phaseName').orientation)
% colorize according to custom color
oM = ipfColorKey(ebsd('phaseName'))
color = oM.orientation2color(ebsd('phaseName').orientations);
plot(ebsd('phaseName'),color)
% specify the color directly and show in Legend
badMAD = ebsd.mad > 1;
plot(ebsd(badMAD),'faceColor','black,'DisplayName','bad values')
Input
| ebsd | |||||||
| color |
length(ebsd) x 3 vector of RGB values |
||||||
| param,val | Parameters and values that control plot
|
||||||
| param | Options that control the plot behavior
|
Example
mtexdata forsterite
plot(ebsd)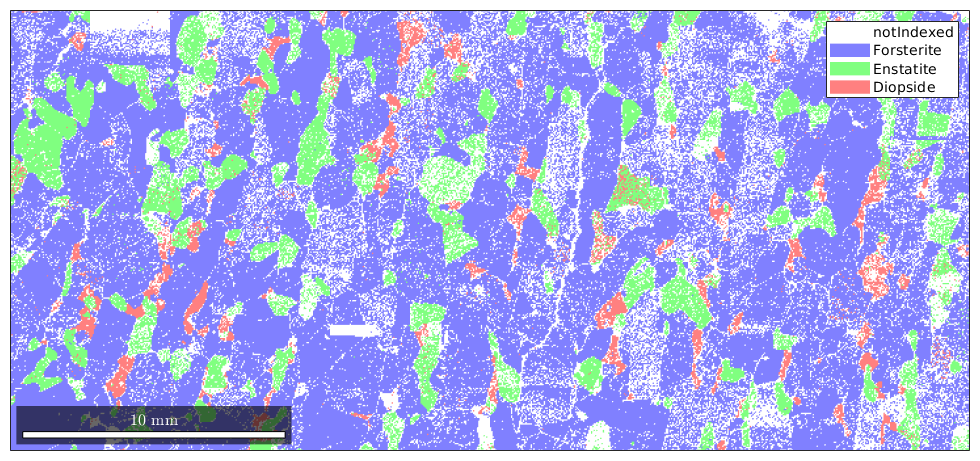
% colorize accoding to orientations
plot(ebsd('Forsterite'),ebsd('Forsterite').orientations)

% colorize according to MAD
plot(ebsd,ebsd.mad,'micronbar','off')
See also
| DocHelp 0.1 beta |