First Steps and Function Overview
Get in touch with grains.
Grain reconstruction from EBSD data
So far grains can be exclusively computed from EBSD data using the command calcGrains. In order to demonstrate grain reconstruction we import some EBSD data
mtexdata forsterite
plotx2east

% plot the Forsterite phase colorized according to orientation
plot(ebsd('fo'),ebsd('fo').orientations)
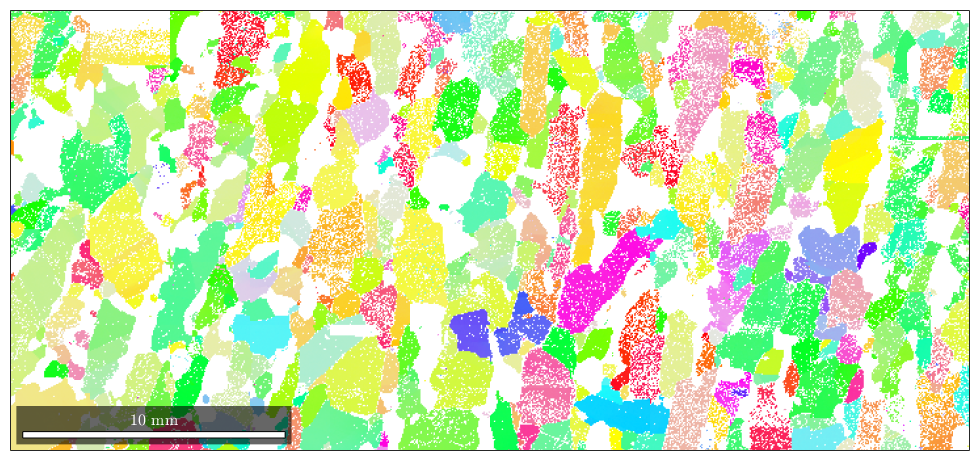
When reconstructing grain there are two basic ways how to deal with not indexed measurements. The simplest way is to keep the not indexed pixels separately, i.e., do not assign them to any indexed grain.
[grains, ebsd.grainId] = calcGrains(ebsd,'angle',5*degree)
grains = grain2d

 Phase  Grains  Pixels     Mineral  Symmetry  Crystal reference frame
     0   16334   58485  notIndexed
     1    4331  152345  Forsterite       mmm
     2    1866   26058   Enstatite       mmm
     3    2012    9064    Diopside     12/m1       X||a*, Y||b*, Z||c

 boundary segments: 148741
 triple points: 12065

 Properties: GOS, meanRotation


ebsd = EBSD

 Phase  Orientations     Mineral        Color  Symmetry  Crystal reference frame
     0   58485 (24%)  notIndexed
     1  152345 (62%)  Forsterite   light blue       mmm
     2   26058 (11%)   Enstatite  light green       mmm
     3   9064 (3.7%)    Diopside    light red     12/m1       X||a*, Y||b*, Z||c

 Properties: bands, bc, bs, error, mad, x, y, grainId
 Scan unit : um
We observe that there are not only grains of specific phases but also not indexed grains. Let's add the grain boundaries to the previous plot.
hold on
plot(grains.boundary)
hold off
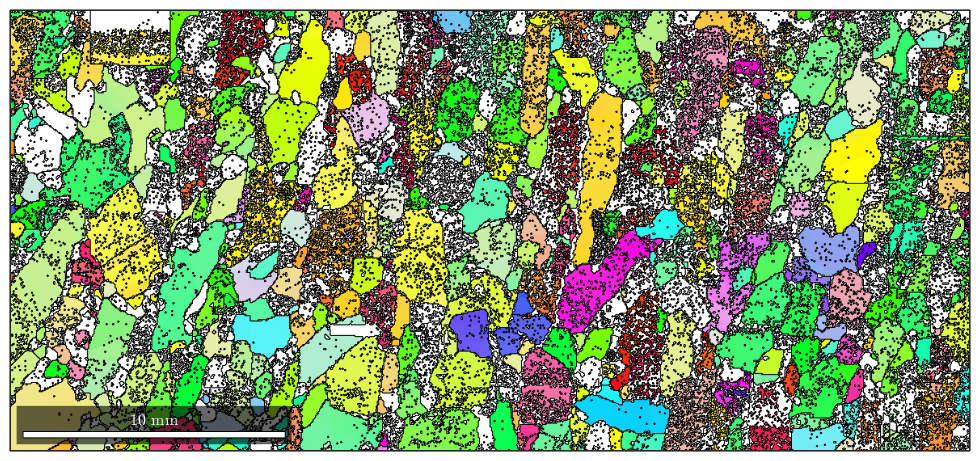
The resulting grains contain a lot of holes and one-pixel grains. The second way is to assign not indexed pixels to surrounding grains. In MTEX this is done if the not indexed data are removed from the measurements, i.e.
ebsd = ebsd('indexed') % this removes all not indexed data
[grains, ebsd.grainId] = calcGrains(ebsd,'angle',5*degree)
ebsd = EBSD

 Phase  Orientations     Mineral        Color  Symmetry  Crystal reference frame
     1  152345 (81%)  Forsterite   light blue       mmm
     2   26058 (14%)   Enstatite  light green       mmm
     3   9064 (4.8%)    Diopside    light red     12/m1       X||a*, Y||b*, Z||c

 Properties: bands, bc, bs, error, mad, x, y, grainId
 Scan unit : um


grains = grain2d

 Phase  Grains  Pixels     Mineral  Symmetry  Crystal reference frame
     1    1256  152345  Forsterite       mmm
     2     518   26058   Enstatite       mmm
     3    1526    9064    Diopside     12/m1       X||a*, Y||b*, Z||c

 boundary segments: 45832
 triple points: 3863

 Properties: GOS, meanRotation


ebsd = EBSD

 Phase  Orientations     Mineral        Color  Symmetry  Crystal reference frame
     1  152345 (81%)  Forsterite   light blue       mmm
     2   26058 (14%)   Enstatite  light green       mmm
     3   9064 (4.8%)    Diopside    light red     12/m1       X||a*, Y||b*, Z||c

 Properties: bands, bc, bs, error, mad, x, y, grainId
 Scan unit : um
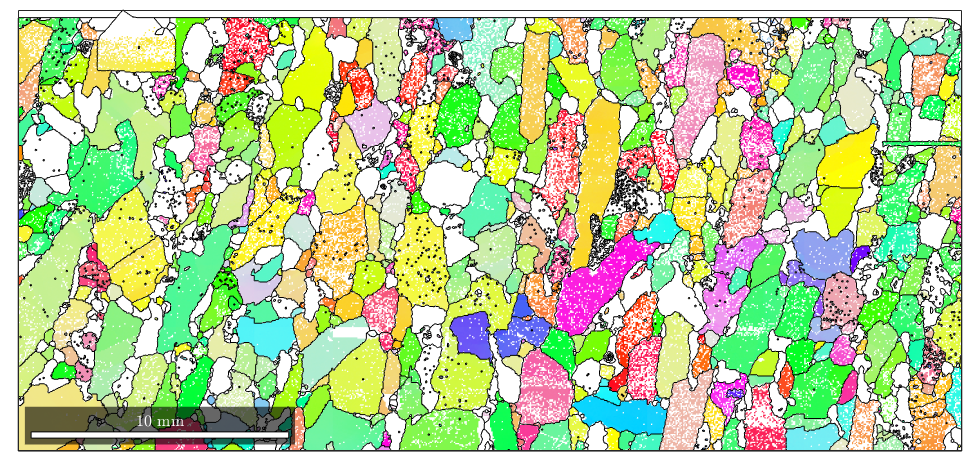
Now, there are no not indexed grains computed. Let's visualize the result
% plot the orientation data of the Forsterite phase
plot(ebsd('fo'),ebsd('fo').orientations)

% plot the grain boundary on top of it
hold on
plot(grains.boundary)
hold off
A more detailed discussion on grain reconstruction in MTEX can be found here
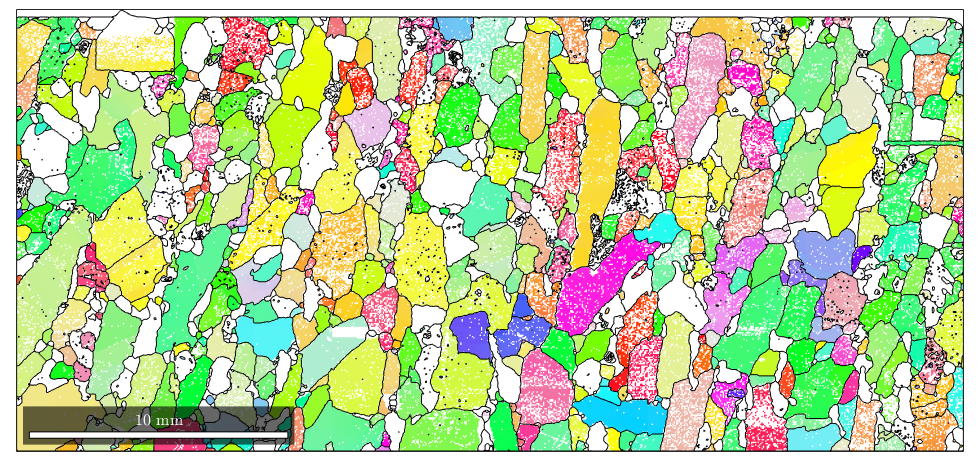
Smoothing grain boundaries
Due to the measurement grid, the grain boundaries often show a typical staircase effect. This effect can be reduced by smoothing the grain boundaries. Using the command smooth.
% smooth the grains
grains = smooth(grains);

% plot the orientation data of the Forsterite phase
plot(ebsd('fo'),ebsd('fo').orientations)

% plot the grain boundary on top of it
hold on
plot(grains.boundary)
hold off
Grain properties
Grains are stored as a long list of several properties. Please find below a table of most of the properties that are stored or can be computed for grains
|
grain area in square grains.scanUnit |
|
|
grain length / grain width |
|
|
list of boundary segments |
|
|
number of boundary segments |
|
|
area difference between grain and its convex hull |
|
|
x,y coordinates of the barycenter of the grain |
|
|
grains.CS |
crystal symmetry (single phase only) |
|
diameter in grains.scanUnit |
|
|
the perimeter of the fitted ellipse |
|
|
the radius of the fitted ellipse |
|
|
grains.GOS |
grain orientation spread |
|
grains.grainSize |
number of measurements per grain |
|
check for inclusions |
|
|
grains.id |
grain id |
|
list of inner boundary segments |
|
|
grains.meanOrientation |
meanOrientation (single phase only) |
|
grains.mineral |
mineral name (single phase only) |
|
number and ids of neighboring grains |
|
|
grains.phase |
phase identifier |
|
perimeter in grains.scanUnit |
|
|
length and width of the fitted ellipse |
|
|
quotient perimeter / perimeter of the fitted ellipse |
|
|
list of triple points |
|
|
grains.x |
x coordinates of the vertices |
|
grains.y |
y coordinates of the vertices |
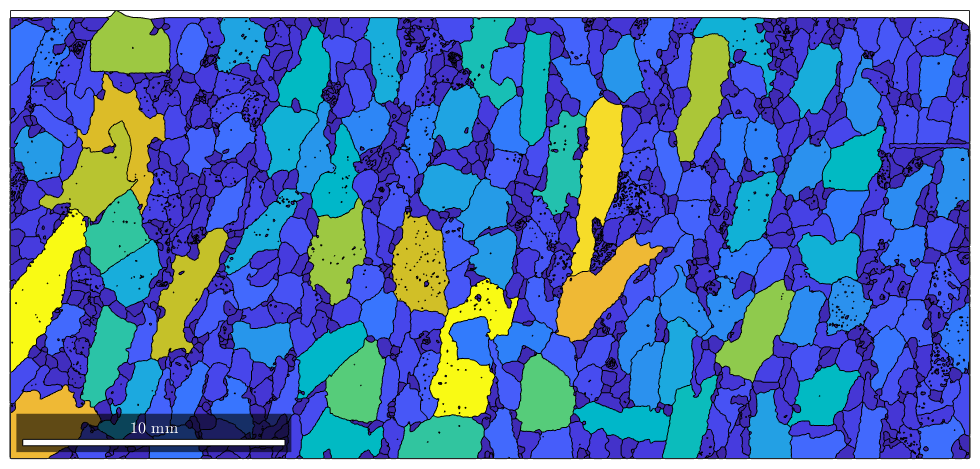
Those grain properties can be used for colorization. E.g. we may colorize grains according to their area.
plot(grains,grains.area)
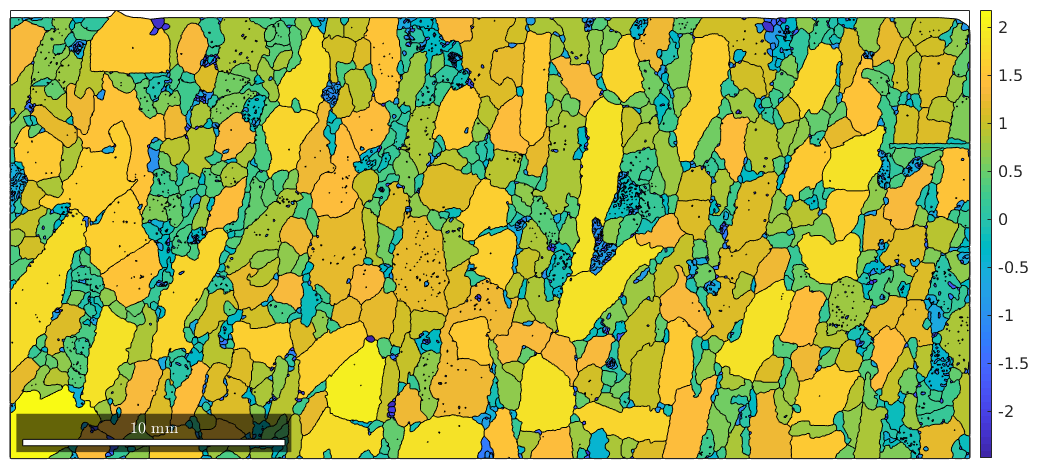
or a little bit more advanced according to the log quotient between grain size and boundary size.
plot(grains,log(grains.grainSize ./ grains.boundarySize))
mtexColorbar
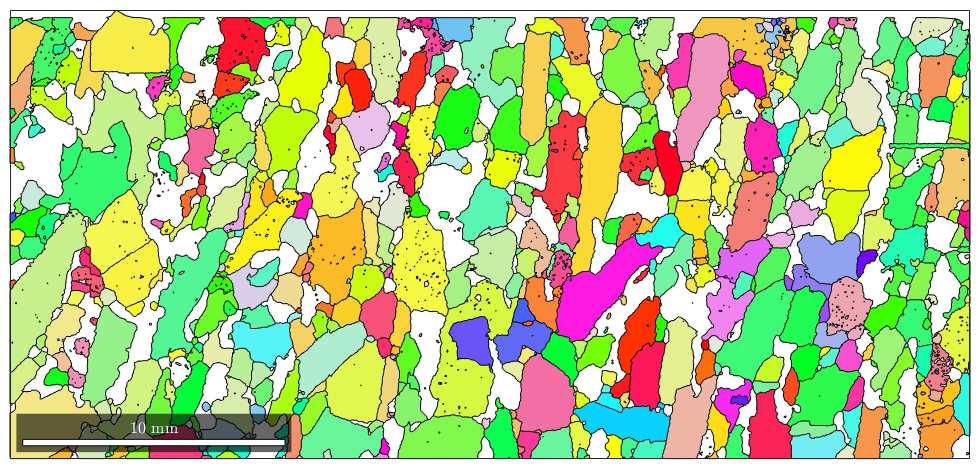
Note that some properties are available for single phase lists of grains, e.g.
% colorize the Forsterite Phase according to its mean orientation
plot(grains('Fo'),grains('Fo').meanOrientation)
  I'm going to colorize the orientation data with the
  standard MTEX colorkey. To view the colorkey do:

  colorKey = ipfColorKey(ori_variable_name)
  plot(colorKey)
Changing lists of grains
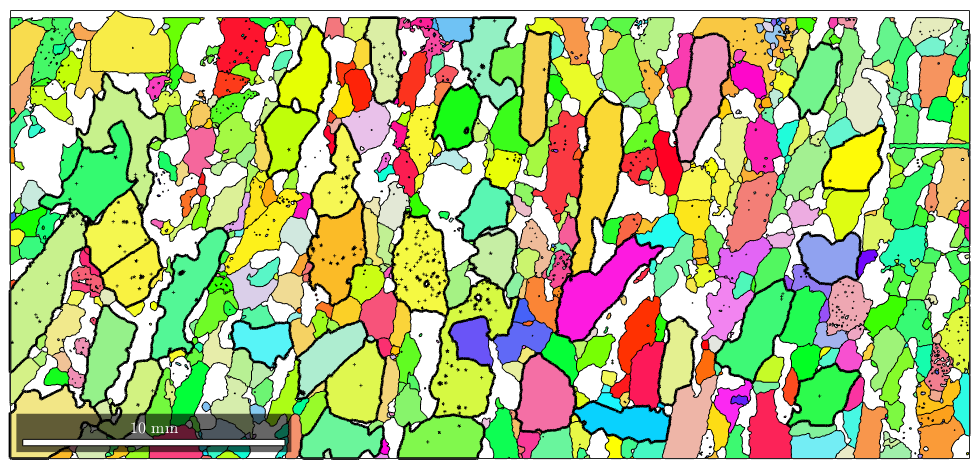
As with any list in MTEX, one can single out specific grains by conditions using the syntax
% this gives all grains with more the 1000 pixels
largeGrains = grains(grains.grainSize > 1000)

hold on
% mark only large Forsterite grains
plot(largeGrains('Fo').boundary,'linewidth',2,'linecolor','k')
hold off
largeGrains = grain2d

 Phase  Grains  Pixels     Mineral  Symmetry  Crystal reference frame
     1      37   58902  Forsterite       mmm
     2       1    1038   Enstatite       mmm

 boundary segments: 10886
 triple points: 816

 Properties: GOS, meanRotation
| DocHelp 0.1 beta |