Short EBSD Analysis Tutorial
How to detect grains in EBSD data and estimate an ODF.
Data import
EBSD data may be imported by the import_wizard by typing
import_wizard
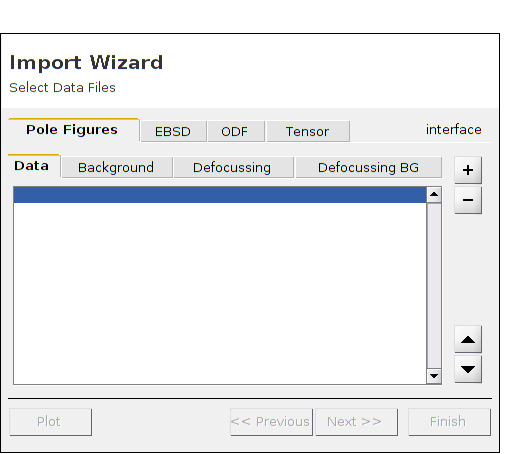
or by the command
fileName = [mtexDataPath filesep 'EBSD' filesep 'Forsterite.ctf'];
ebsd = EBSD.load(fileName)
Warning: .ctf files have usualy inconsistent conventions for spatial coordinates
and Euler angles. You may want to use one of the options
'convertSpatial2EulerReferenceFrame' or 'convertEuler2SpatialReferenceFrame' to
correct for this
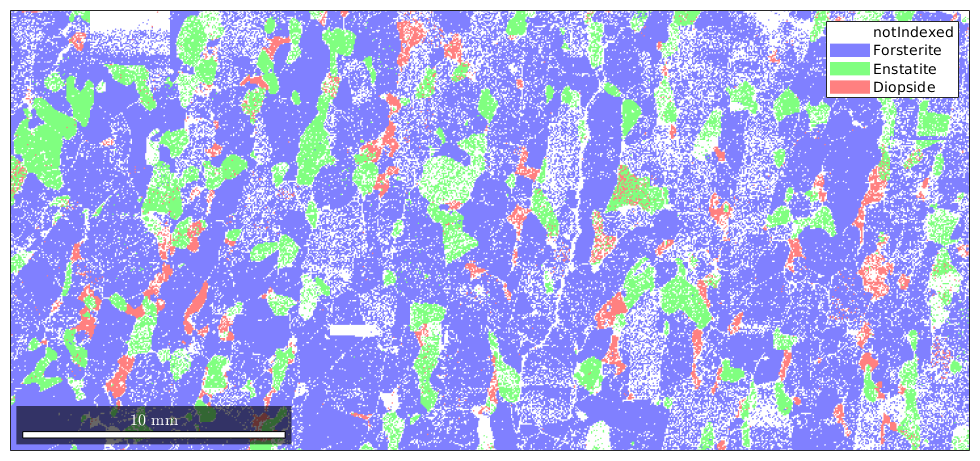
ebsd = EBSD
Phase Orientations Mineral Color Symmetry Crystal reference frame
0 58485 (24%) notIndexed
1 152345 (62%) Forsterite light blue mmm
2 26058 (11%) Enstatite light green mmm
3 9064 (3.7%) Diopside light red 12/m1 X||a*, Y||b*, Z||c
Properties: bands, bc, bs, error, mad, x, y
Scan unit : um
A quick overview of the phases within your data set gives the plot
plot(ebsd)
MTEX supports a wide variety of EBSD file formats. Recommended are text- base file formats like .ang and .ctf over binary file formats like .osc. Special attention has to be paid to the alignment of sample reference frame X Y Z. Different vendors use different conventions. Even the reference frame for the Euler angles and for the spatial coordinates do not need to coincide. How to deal with this is discussed in a separate section.
Visualize EBSD data
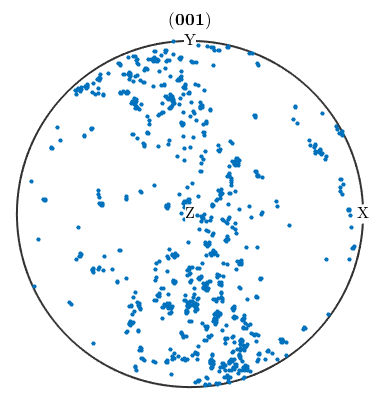
The alignment of the Euler reference frame can be verified by plotting pole figures and comparing them with the pole figures of the vendors system.
% we first need to extract the crystal symmetry of Forsterite
csForsterite = ebsd('Forsterite').CS

% this plots the (001) pole figure of the Forsterite phase
plotPDF(ebsd('Forsterite').orientations,Miller(0,0,1,csForsterite))

% display Euler angle reference frame X, Y, Z
text([vector3d.X,vector3d.Y,vector3d.Z],{'X','Y','Z'},'backgroundColor','w')
csForsterite = crystalSymmetry

  mineral : Forsterite
  color   : light blue
  symmetry: mmm
  a, b, c : 4.8, 10, 6

  I'm plotting 1250 random orientations out of 152345 given orientations
  You can specify the the number points by the option "points".
  The option "all" ensures that all data are plotted
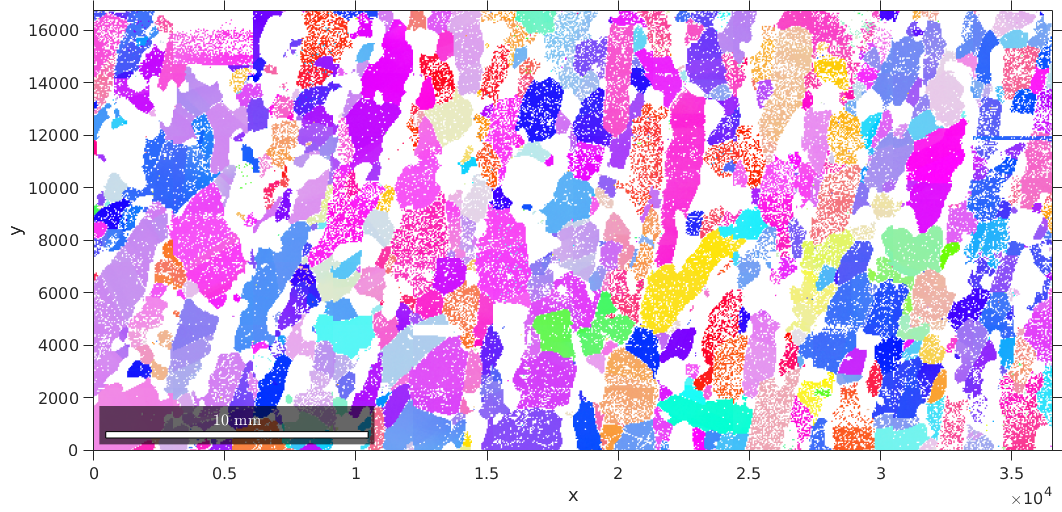
plot(ebsd('Forsterite'),ebsd('Forsterite').orientations,'coordinates','on')
| DocHelp 0.1 beta |